We all need a little inspiration from time to time. Alex dives in and gives us a few different views of the vaunted unicorn club.
In 2013, when Aileen Lee of Cowboy Ventures first coined the “unicorns” term describing startups valued at $1 billion or more, she named 39 companies in the U.S fitting the definition.
In the spring of 2014, when I first set to compile a list of unicorns from around the globe as part of my work at InVenture Partners, the final list consisted of 83 companies, 56 of them in the U.S.
Over the next few years, this number continued to increase at an alarming pace, with CB Insights now highlighting 186 companies, and CrunchBase Unicorn Leaderboards listing 224 unicorns and 43 exited unicorns as of February 25th, 2017.

Still, those lists, while highly interesting, don’t necessarily provide the depth of insight offered in the original article by Aileen Lee. I thought it might be interesting to revisit the topic today, and explore what unicorns from around the world have in common and what differentiates them from each other.
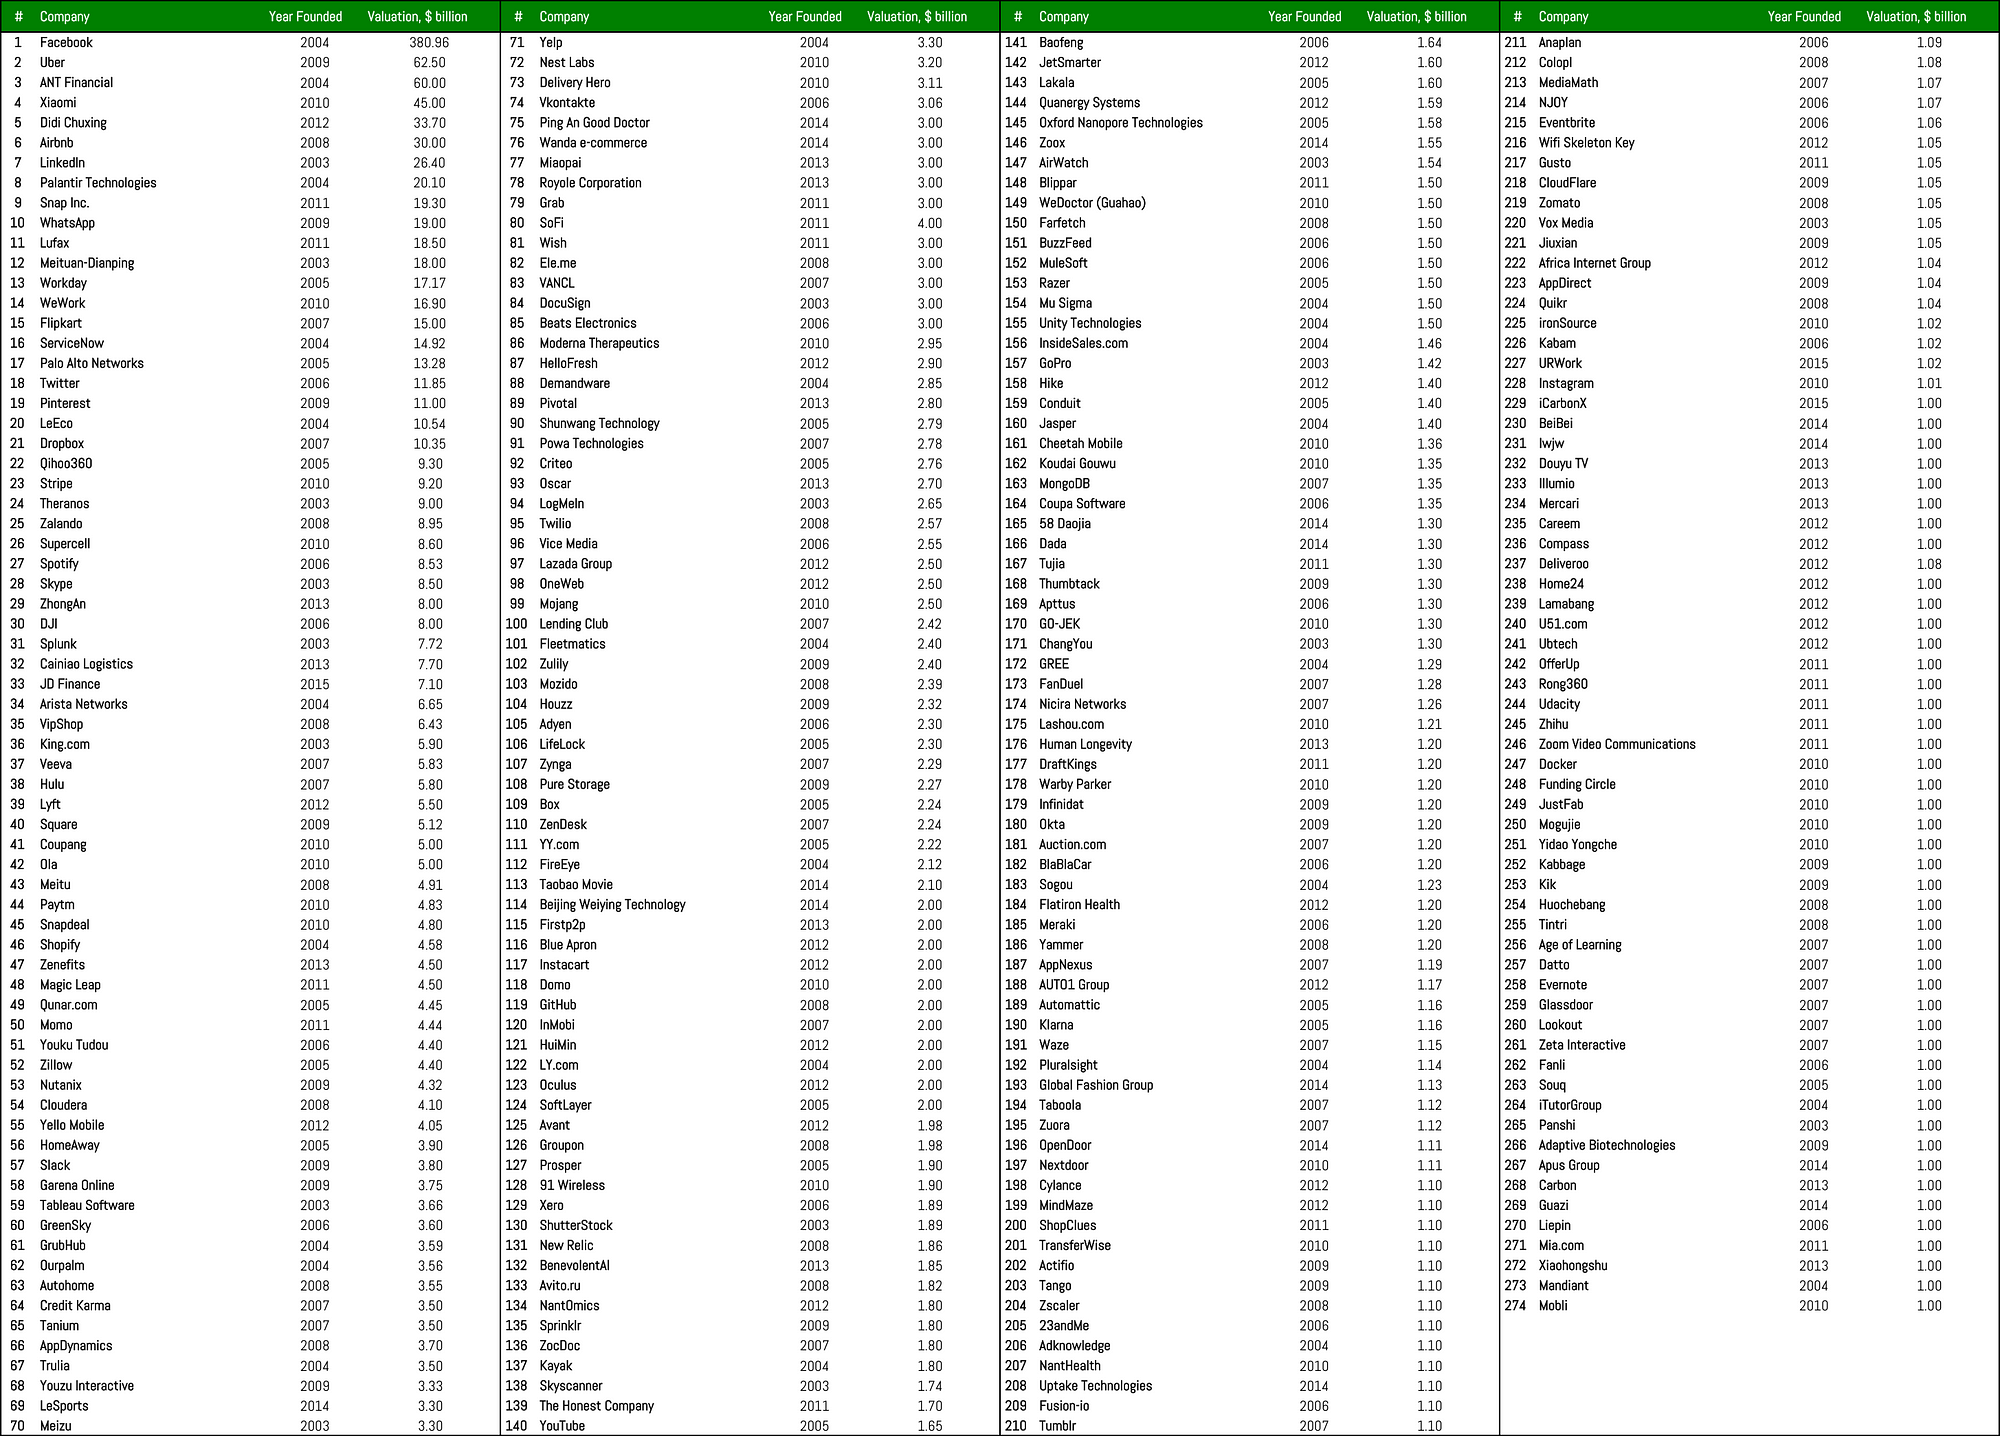
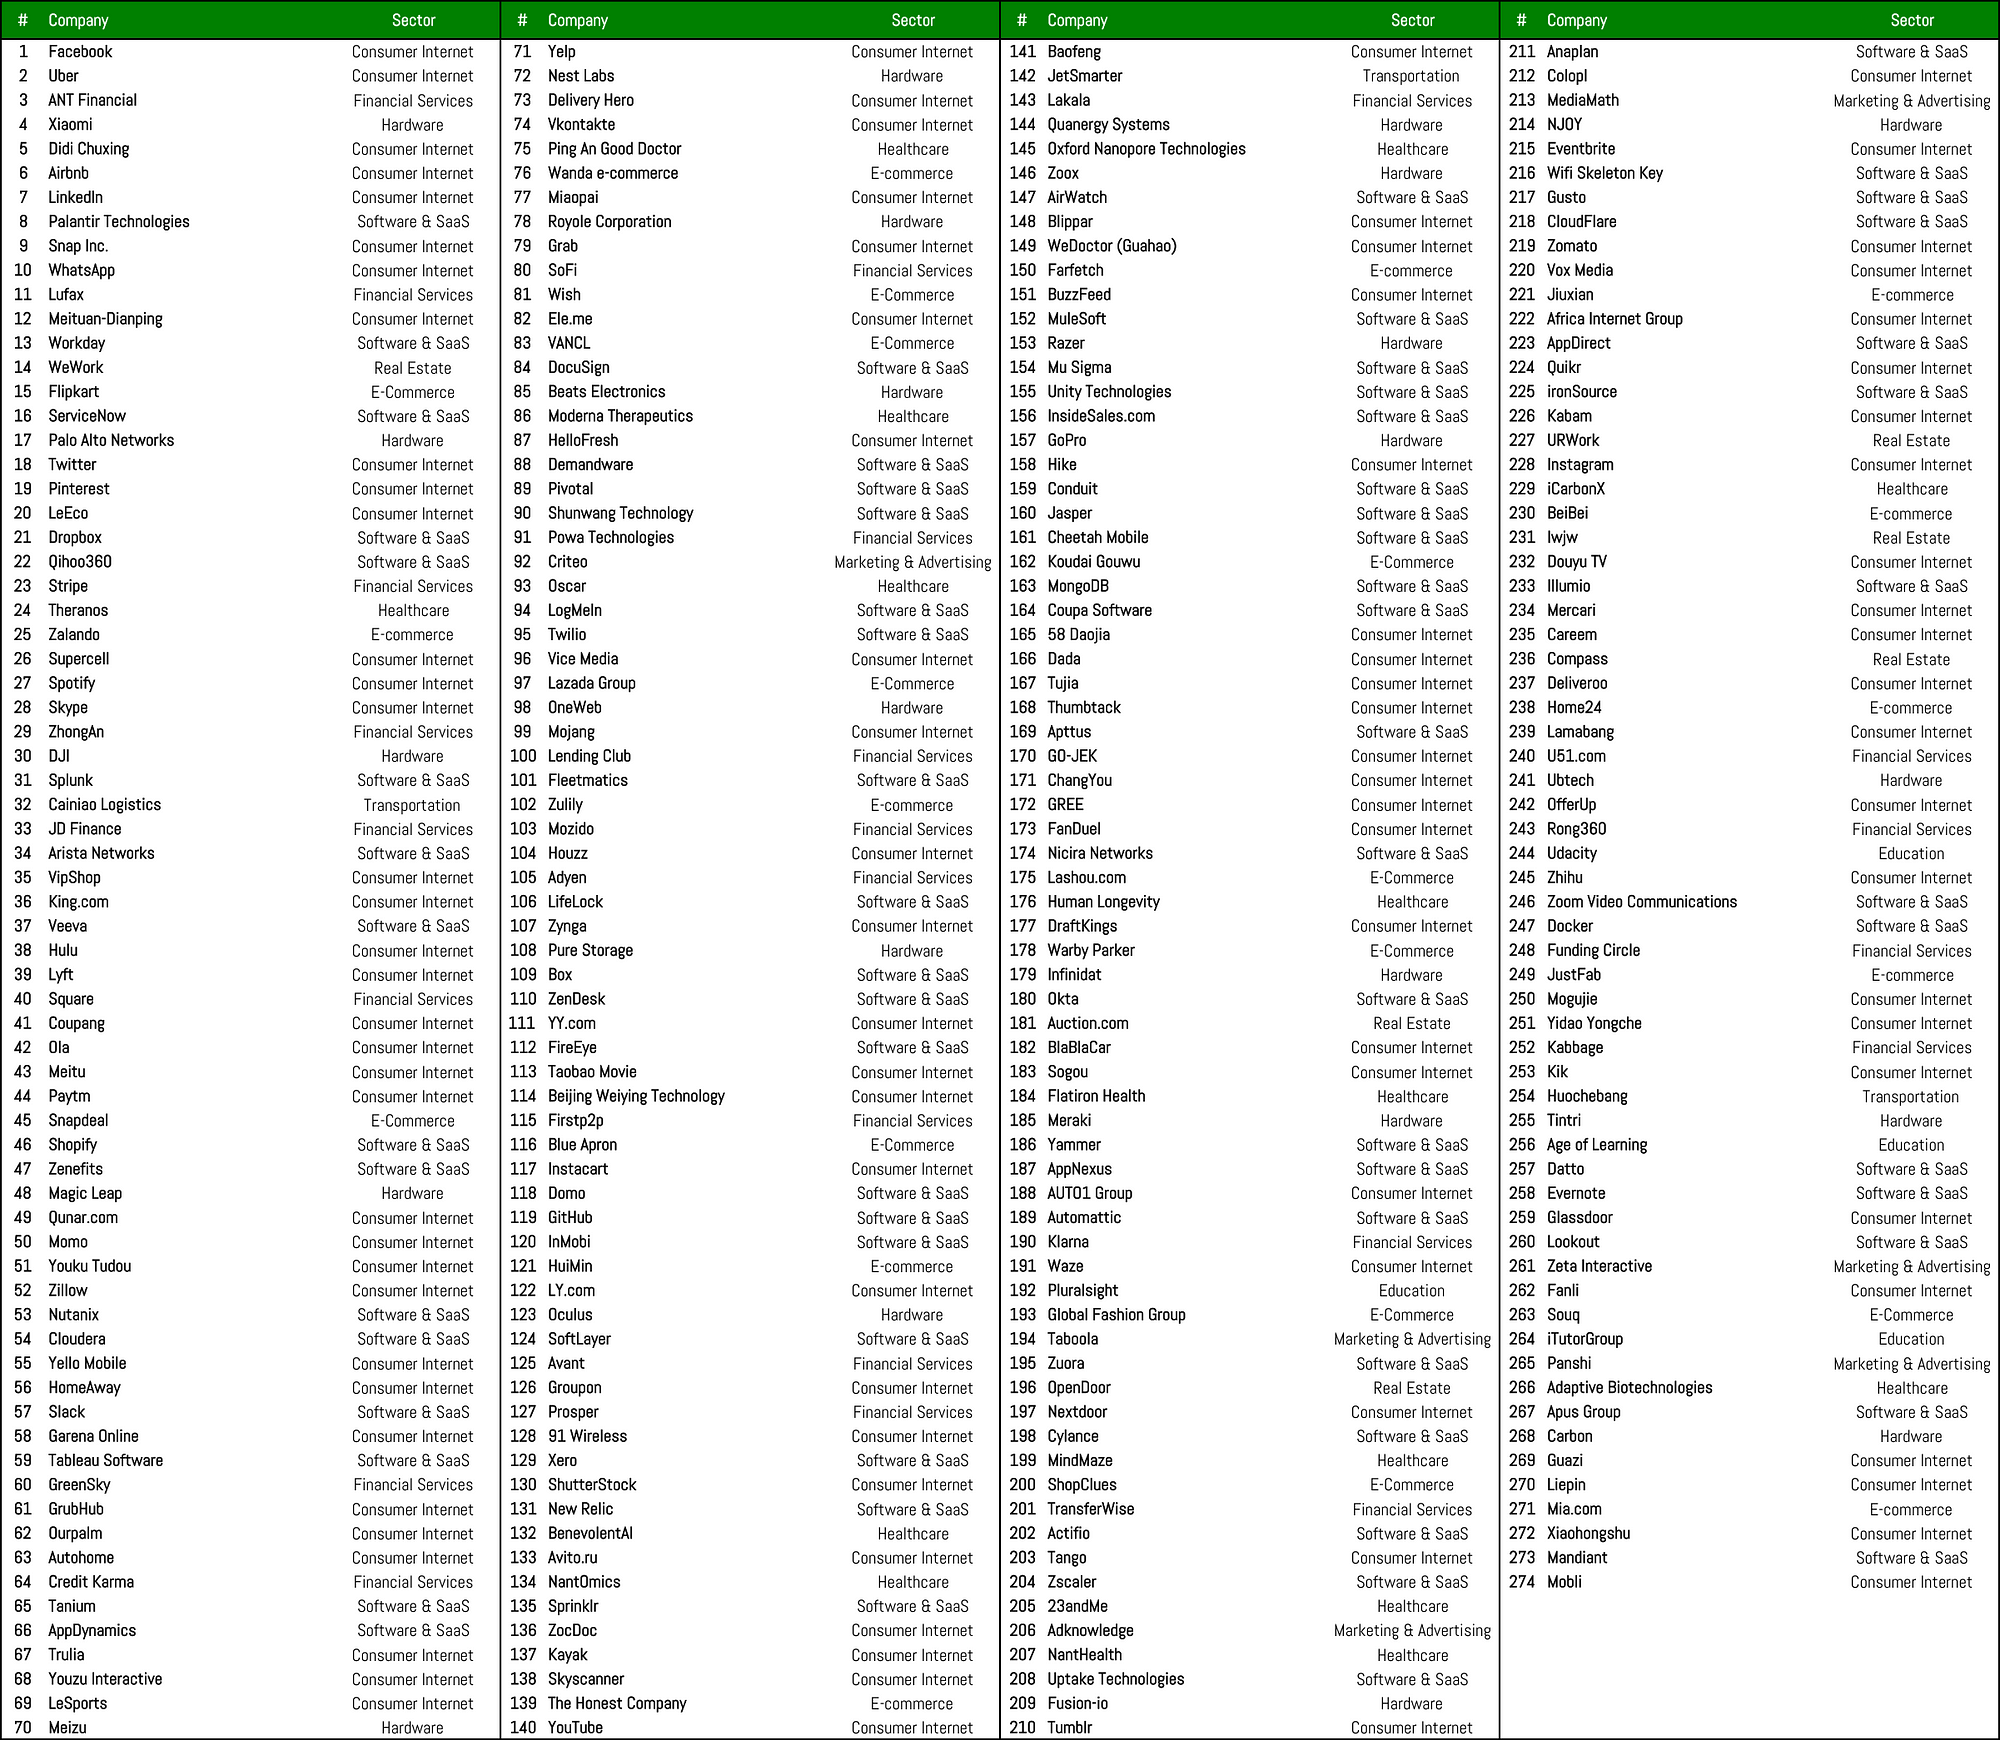
To do that, I set to compile a list of companies that qualify to be called “unicorns” that carries as much information as possible. This list includes all startups co-founded since 2003 for which the latest post-money valuation is either equal or over $1 billion, including those that are publicly traded or acquired.
You can see a quick snapshot of the dataset below:
Before jumping into the analysis, it’s worth noting a few things:
- First of all, this list, while being quite extensive, is by no means comprehensive, and it’s quite possible that I’ve still missed some companies.
- Second, it’s based on a snapshot in time, meaning that it doesn’t include any updates in valuations or the companies that reached “unicorn” status after January 27th, 2017
- Finally, as it’s based on publicly available information, it is possible that certain numbers are incorrect or outdated
The last point is especially important for the companies whose valuations are supposed to have plummeted recently (think Xiaomi, Theranos and a few others): unless there was a formal down round, or the company is publicly traded, the valuation used for the purposes of this analysis is still the one the company received in the most recent round.
The same is true for the companies that haven’t raised funding in a long time (Klarna is one example) and are supposedly worth much more today than they were during the last round of financing. While this might skew the numbers a bit, I see no way to objectively adjust these valuations, which is why I’m sticking with confirmed valuations.
With that said, let’s now jump straight to the analysis.
Overview
To date, 274 companies started in 2003 or later have reached the coveted “unicorn” status, and, perhaps even more importantly, maintained this status. The last remark is crucial, as quite a few companies that at some point of time were supposed to be worth around $1 billion or more have since long lost their place on the pedestal (Fab, Gilt Groupe or LivingSocial are just a few names that immediately come to mind).
That being said, below you can see the distribution of unicorns by the year they were founded, as well as the average valuations for each year. Unless otherwise noted, I’m using the latest confirmed valuation to calculate the averages; for publicly traded companies, that means using the latest market cap.
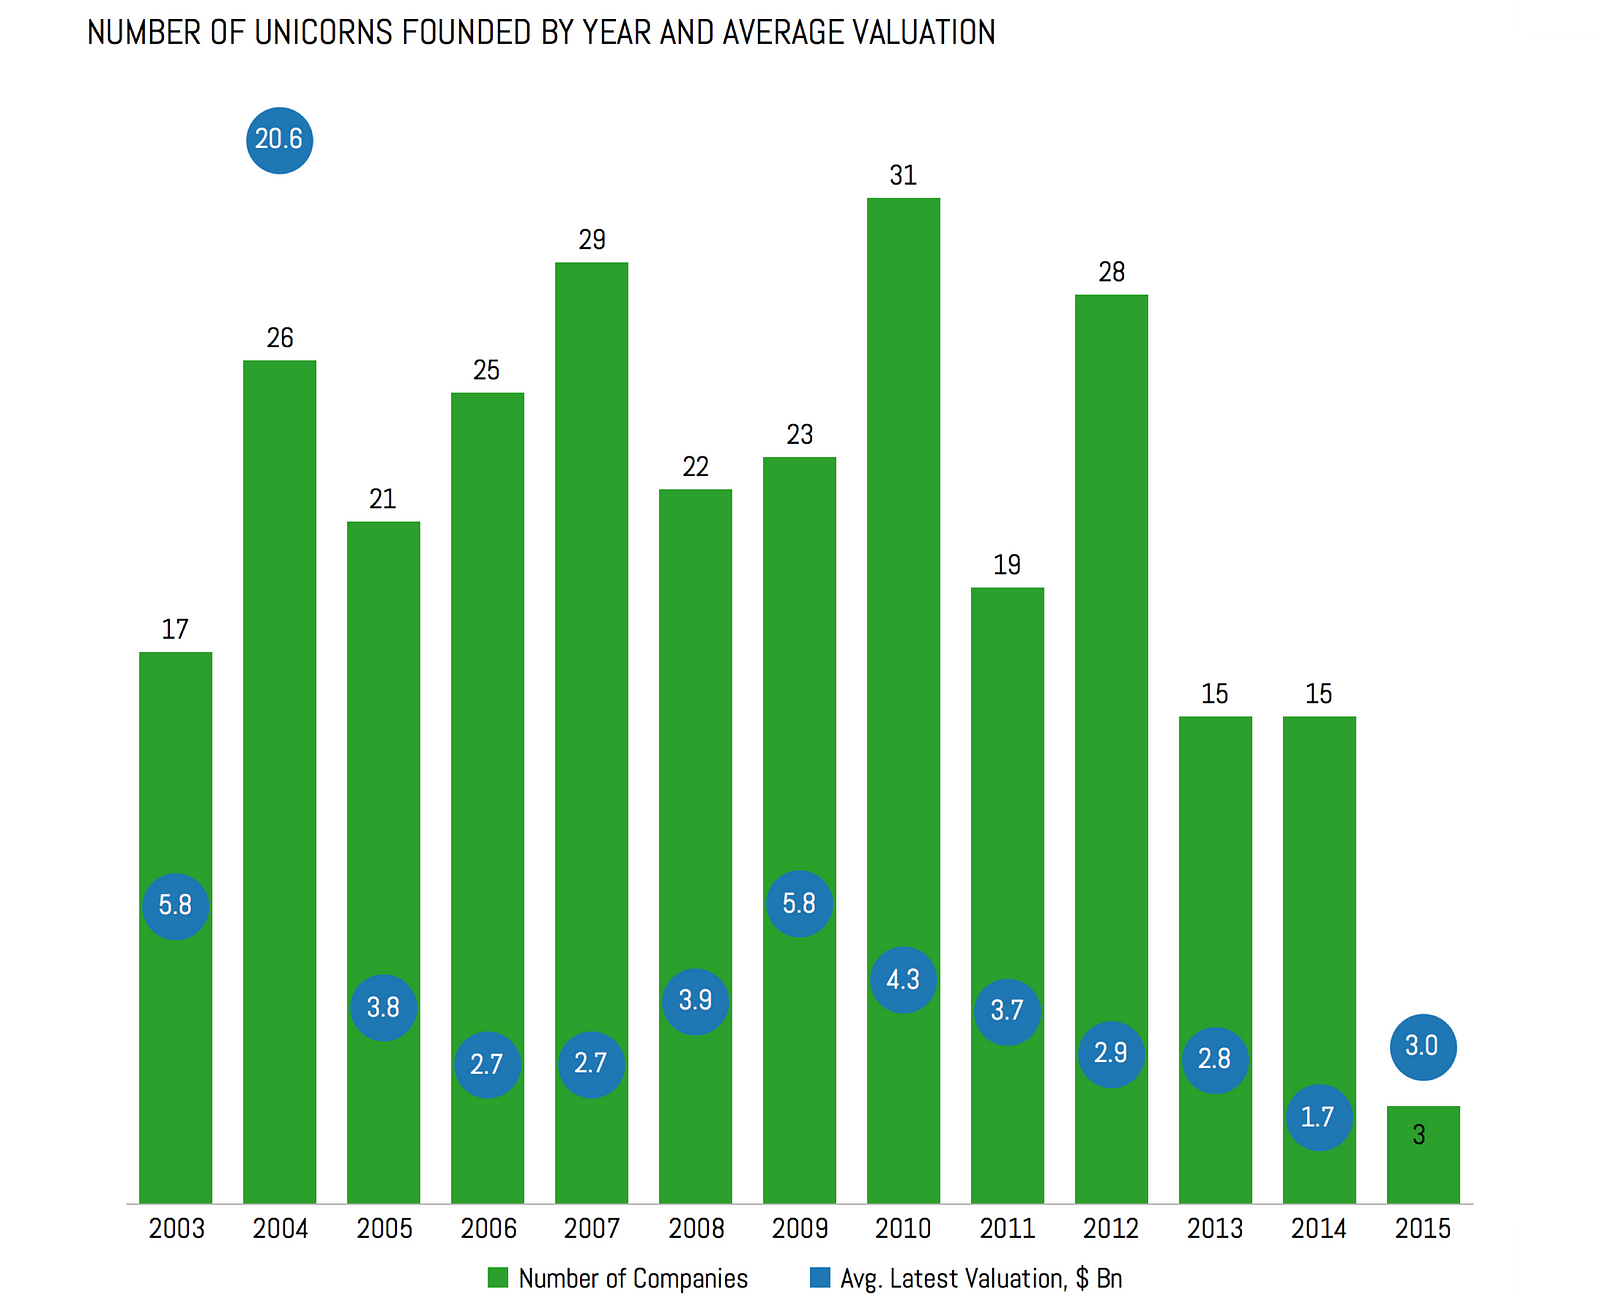
As you can see, the numbers remain relatively consistent across the years, although there are 4 spikes (in 2004, 2007, 2010 and 2012) in the number of unicorns being founded in any particular year. Also, while the number of unicorns seems to start declining in 2013–2015, it’s more likely that a number of high potential startups founded in 2013 or later just haven’t reached the unicorn status yet.
According to a number of estimates, the time to reach $1 billion valuation is rapidly decreasing, but still, even for very successful companies it takes 2–3 years to get there.
Another thing you might immediately notice on this chart is that 2004 was a huge outlier in terms of the average valuation. Obviously, that was driven by Facebook, which with its current market cap of about $380 billion is by far the biggest unicorn to date. Same goes for 2009, which is the year when Uber was founded.
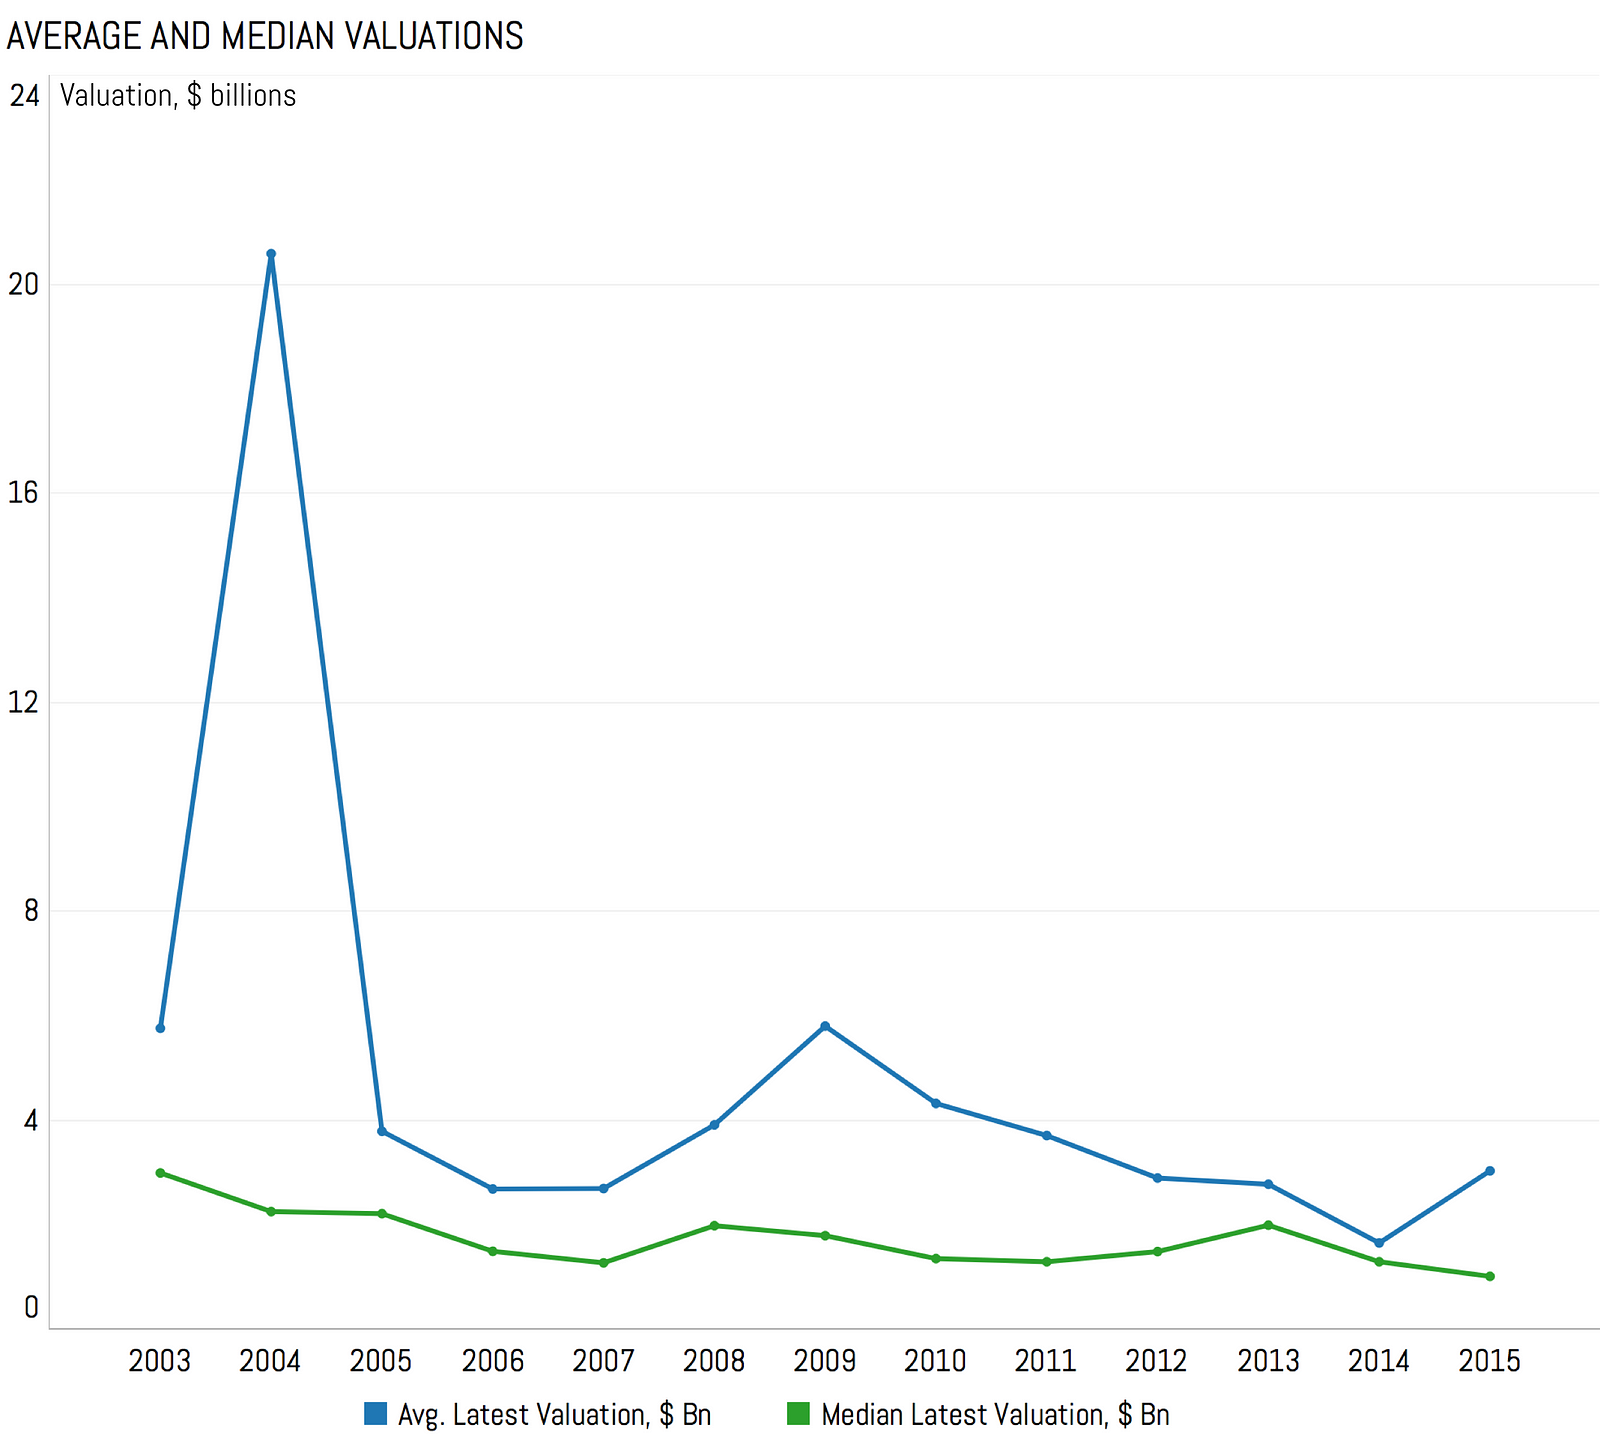
To account for that, we might want to switch to the median valuations. As you can see below, the median valuations are much more consistent over the years, and are also much lower than the average ones, remaining below $4 billion for any particular year.
Now, if you look at the list of the startups at the beginning of the post long enough, you might notice that some of the companies there are not necessarily startups in the traditional sense of the world, but rather are spin-offs or joint ventures of established players (e.g. JD Finance or Hulu). While those companies might seek outside funding and generally operate independently from their parent companies, one might claim that they still have an “unfair advantage” over other startups and should therefore be excluded from the analysis.
Besides that, several companies on the list (namely, Supercell and Skype), while perfectly fitting in the traditional startup definition when they were founded, have since undergone a series of acquisitions, which means there were periods of time when those companies again could be viewed as subsidiaries of larger corporations.
Finally, there are several companies (e.g. Taboola, Zuora and a few others) for which the valuations of over $1 billion were widely reported, but never confirmed by the companies or their investors.
Let’s exclude all of those for a moment and look once again at the distribution of the startups by the year they were founded.
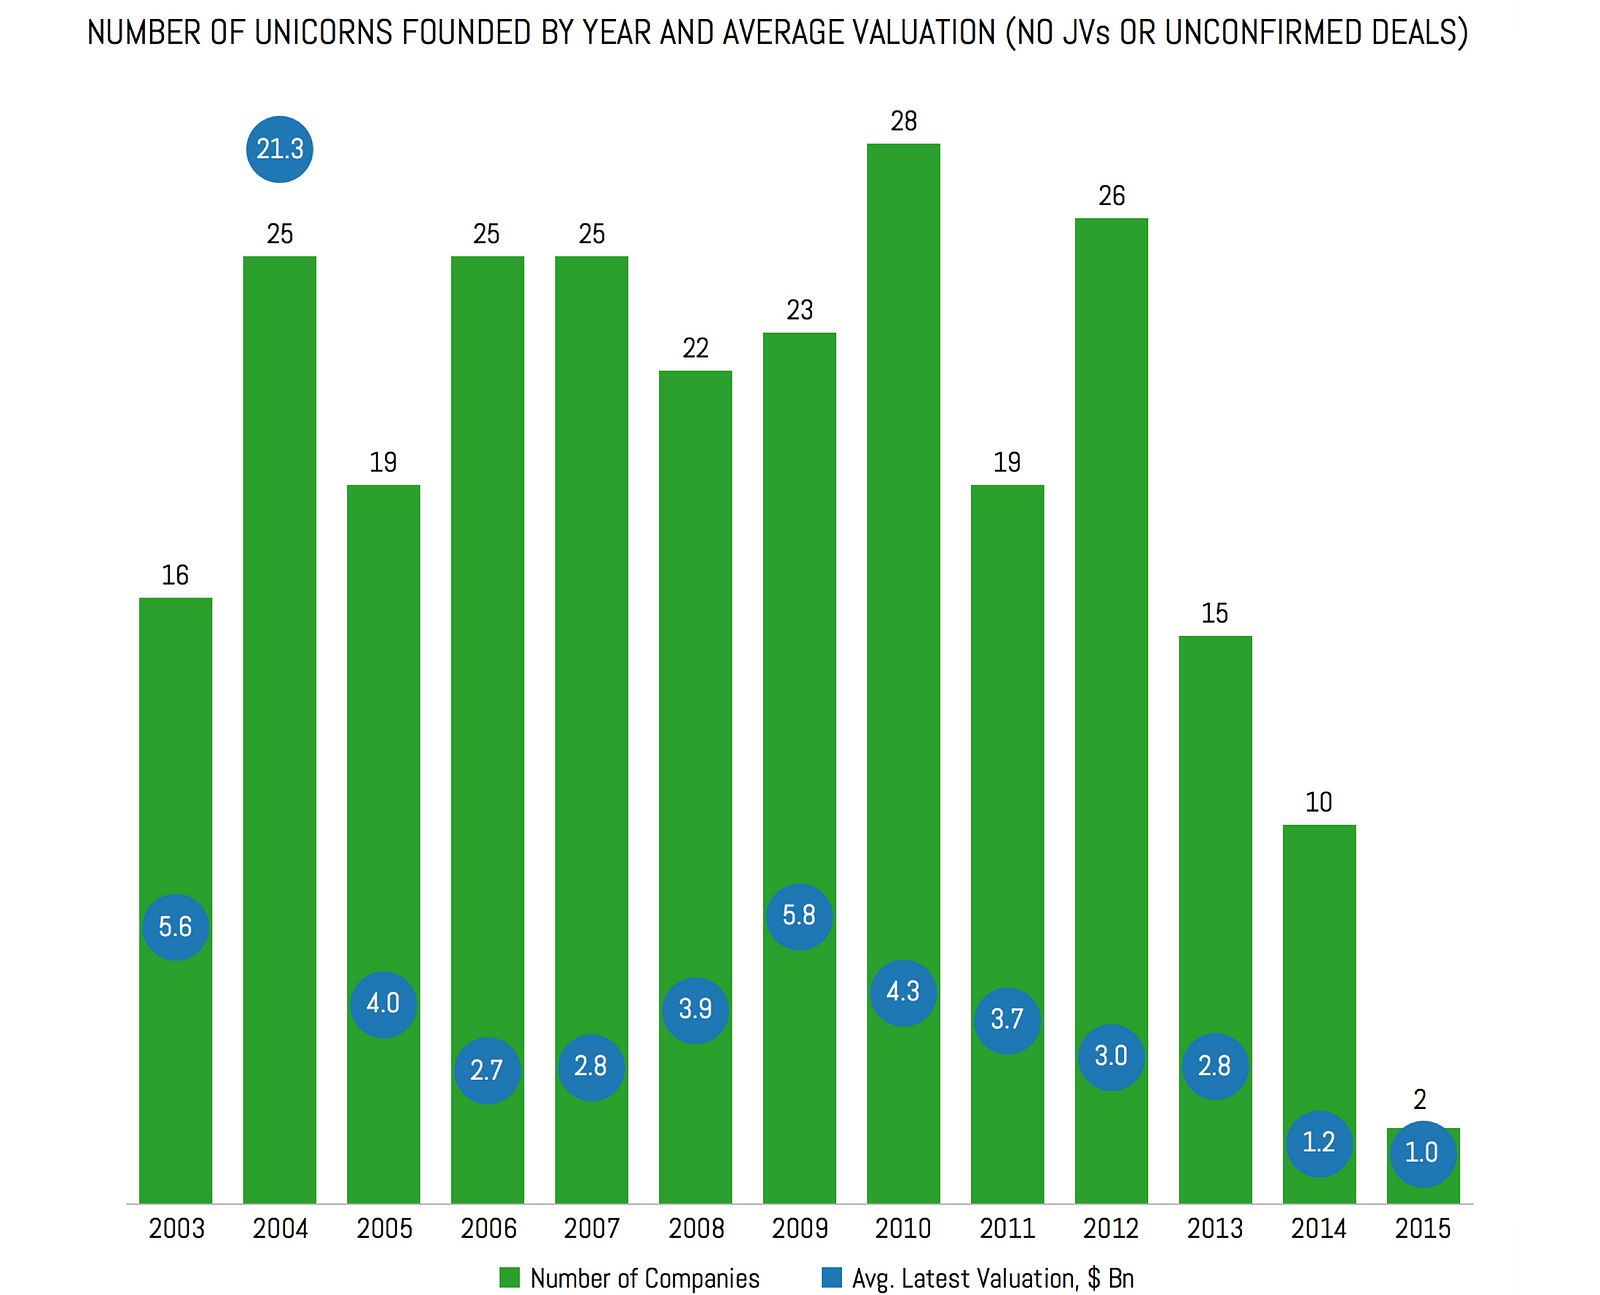
As you can see, this chart doesn’t look significantly different from the previous one, although the peaks are now slightly less pronounced, and the average valuations are slightly lower for most of the years.
The Unicorns, and Where to Find Them
Now let’s take a look at the geographic distribution of the unicorns.

For the most part, this map brings no surprises: the majority of the unicorns are headquartered in the U.S. (148) and China (69), followed by the U.K. (10), India (9), Israel (5) and Germany (5).
If we look at the continents, North America is leading the pack with 150 startups originated there, followed by Asia (89 startups) and Europe (33 companies, including companies founded in Russia and Israel).
So far, there are no unicorns in South America, or Australia (Atlassian, founded in 2002, unfortunately, is too “old” to be included), also, interestingly enough, there is one unicorn (Xero) headquartered in New Zealand.
Finally, there is one unicorn (Africa Internet Group) in Africa, which is essentially a Rocket Internet spin-off.
Now let’s take a look at the average and median valuations by country.
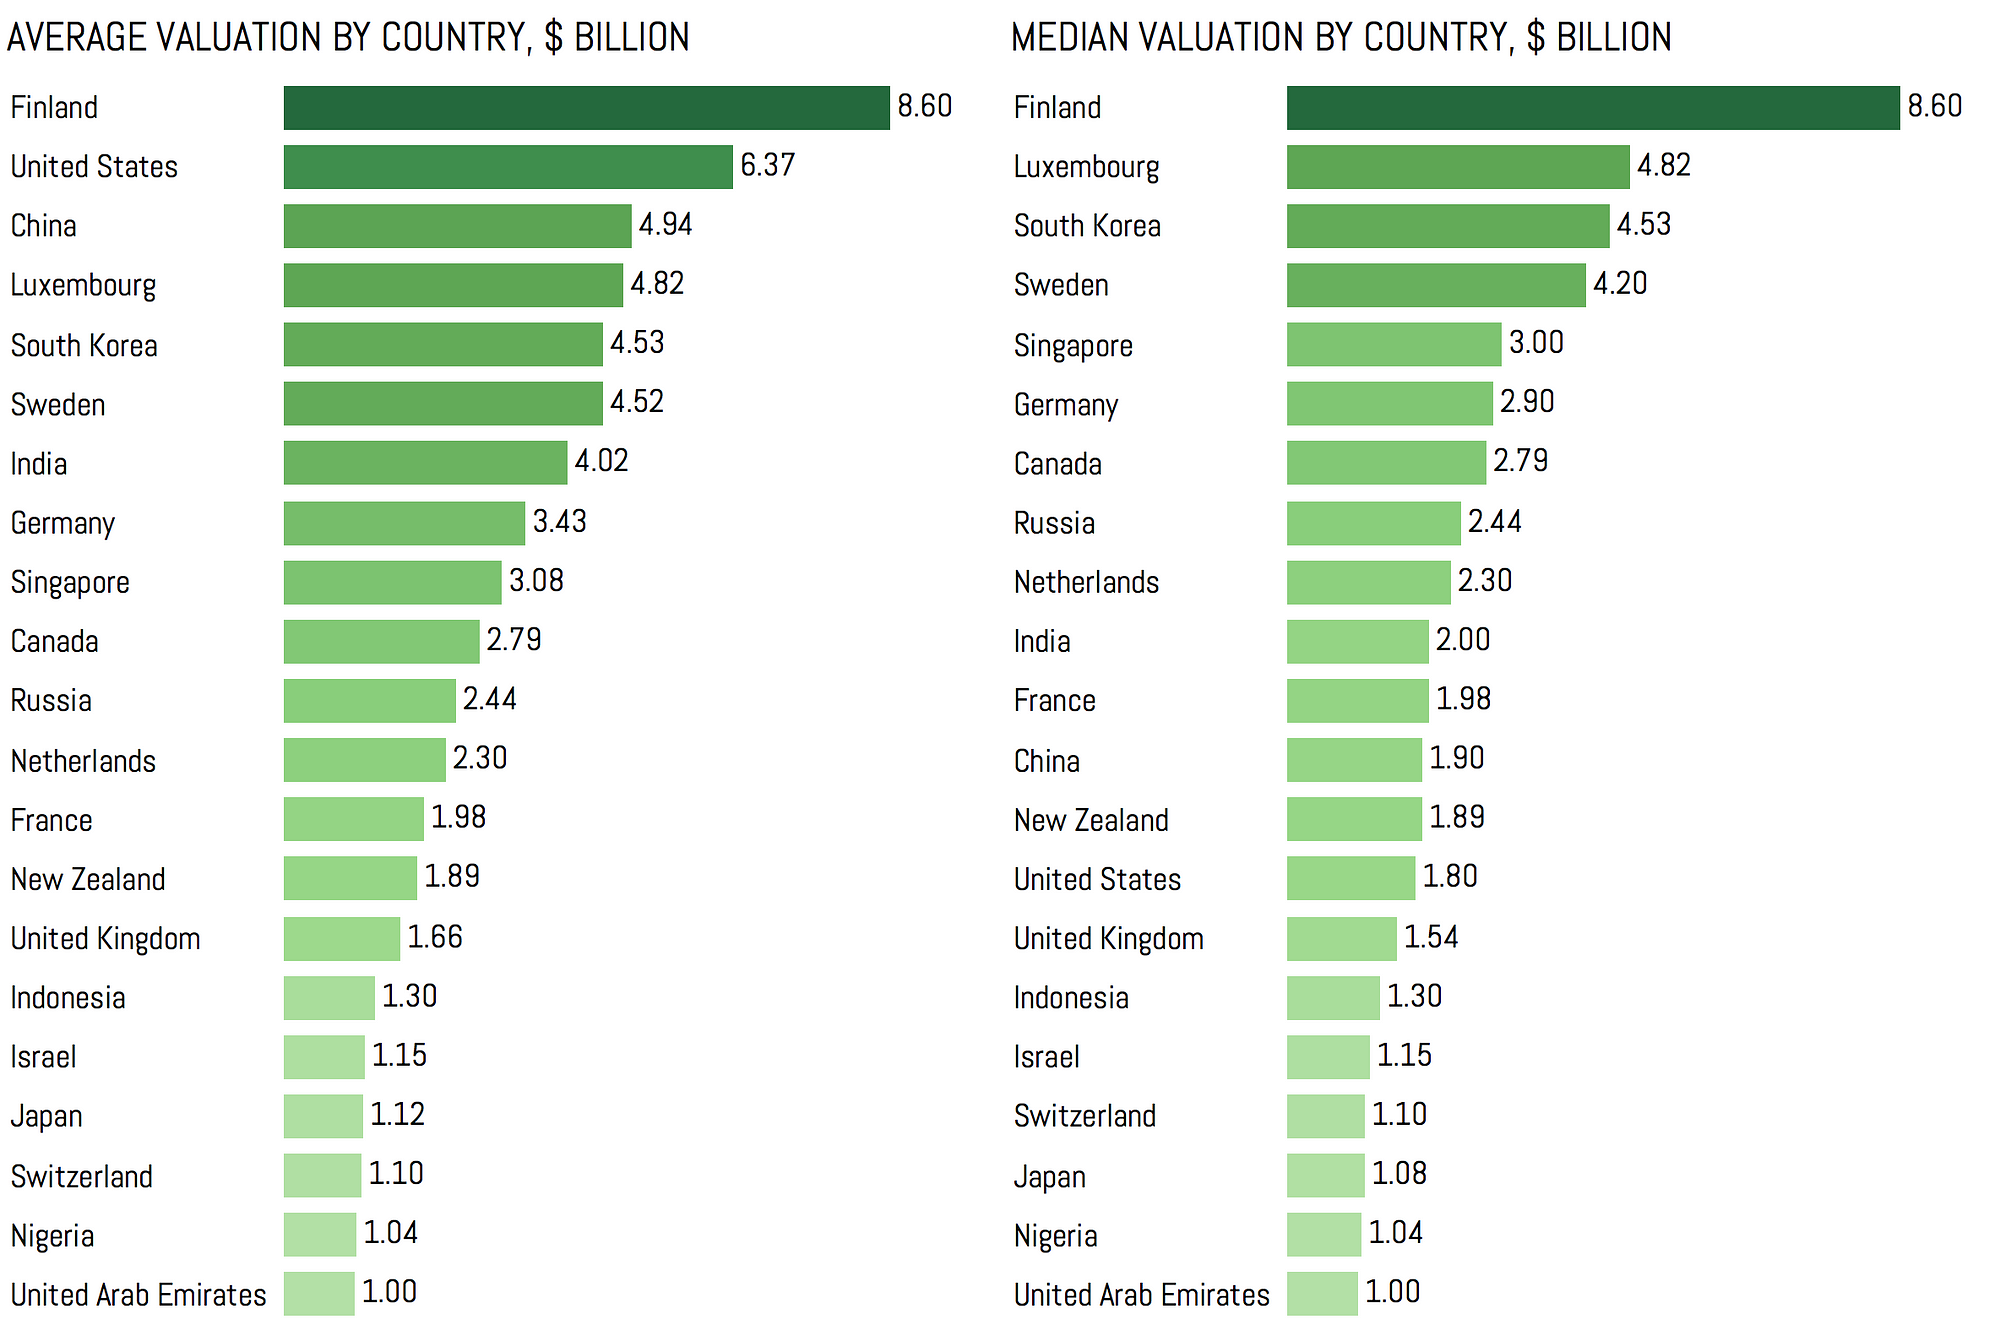
Finland is an obvious outlier here, leading both charts with a single hugely successful company (Supercell).
To a somewhat lesser effect, the same is true for Luxembourg (with Skypedriving the valuations up).
Sweden, South Korea, Singapore and Germany are doing strong both in terms of the average and median valuations, while the U.S. and China are at the very top in terms of average valuations (driven by huge valuations of the largest companies, such as Facebook, Uber, ANT Financial or Didi Chuxing), but are much lower down the list in terms of median valuations (which makes sense given the sheer numbers of startups originating in those two countries).
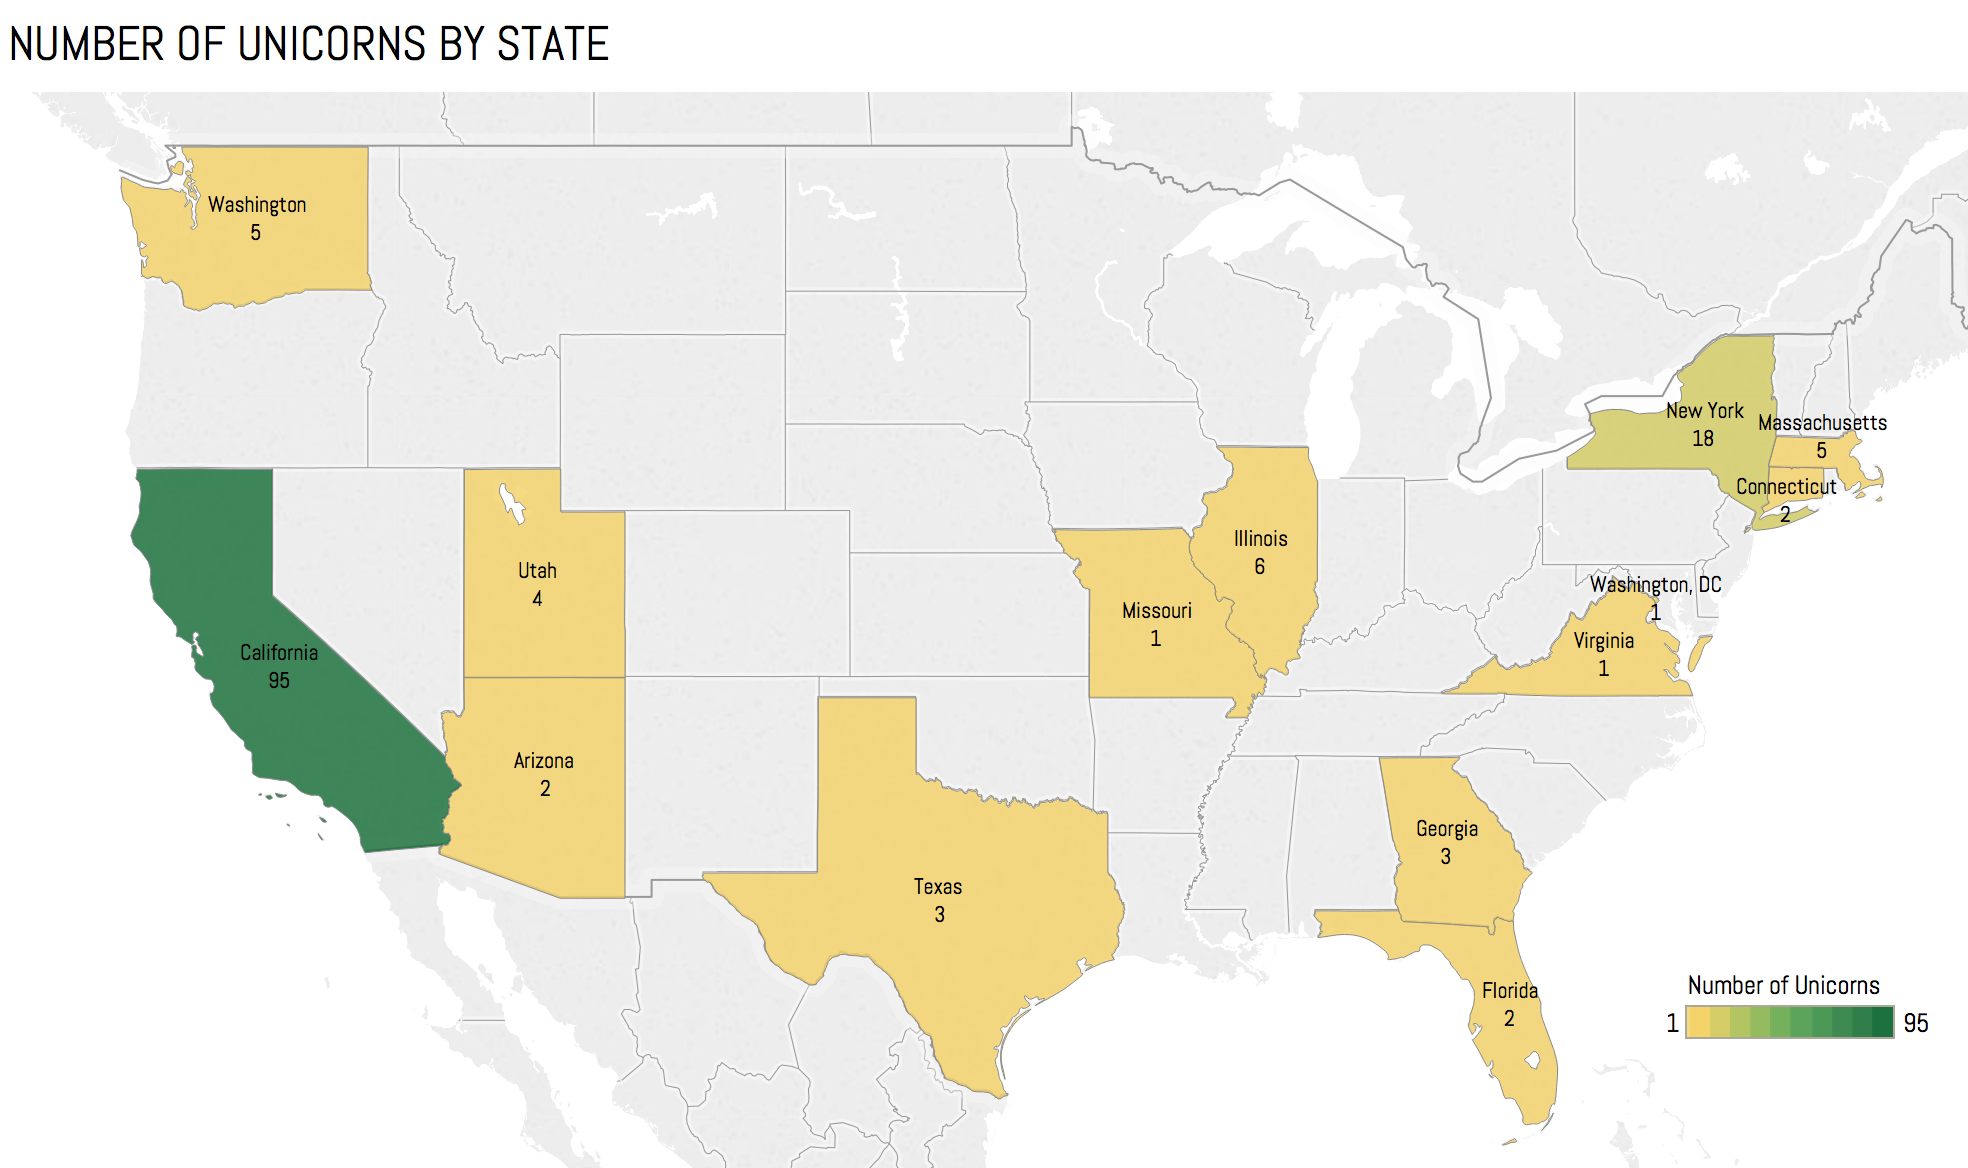
Within the U.S., California unsurprisingly leads the pack with whooping 95 unicorns, followed by New York (18 companies), Illinois (6), Washington (5) and Massachusetts (5). Overall, 14 states can boast having at least one unicorn.
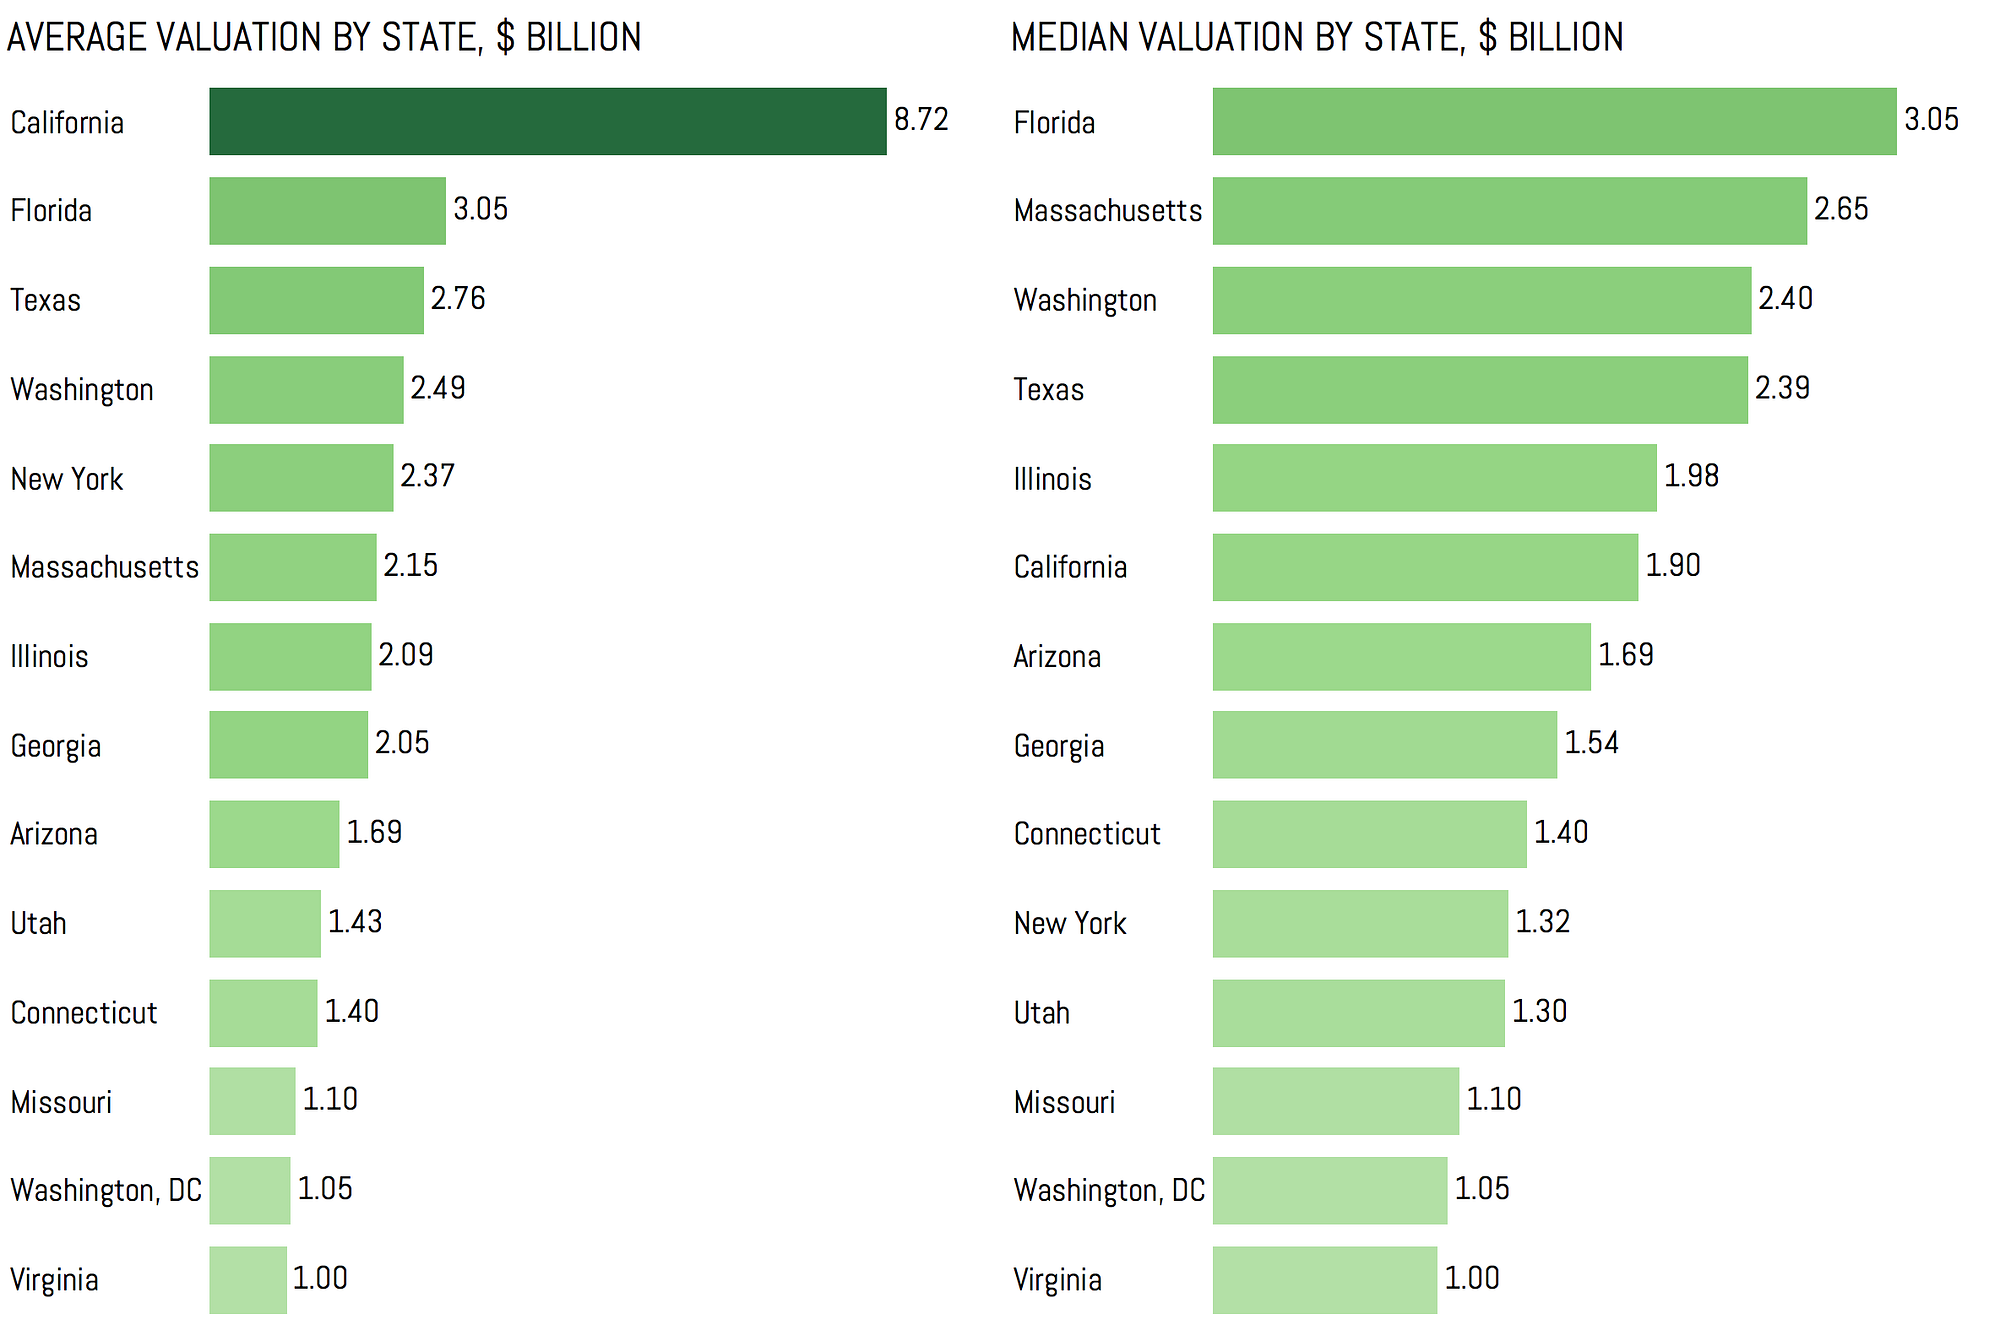
California also boasts the highest average valuations, largely driven by the fact that some of the largest startups reside in the state, while Florida is #1 in terms of the median valuation, with Magic Leap and JetSmarterbased there.
Also, the states with the largest numbers of unicorns also tend to have higher valuations.
Unicorns by Sector
First of all, an important caveat: this is perhaps the most difficult and ambiguous part of this post, as it requires using your own judgement to classify the startups based on the space they are operating in, which by definition makes it highly subjective.
In order to at least partially mitigate the risk of improper classification, I went with rather broad categories wherever possible. Although this somewhat limits the possible depth of insights that can be drawn from this analysis, I believe that it’s a reasonable trade-off in this case (although even then, classification remains a significant issue, especially considering that many startups can theoretically fall under several categories).
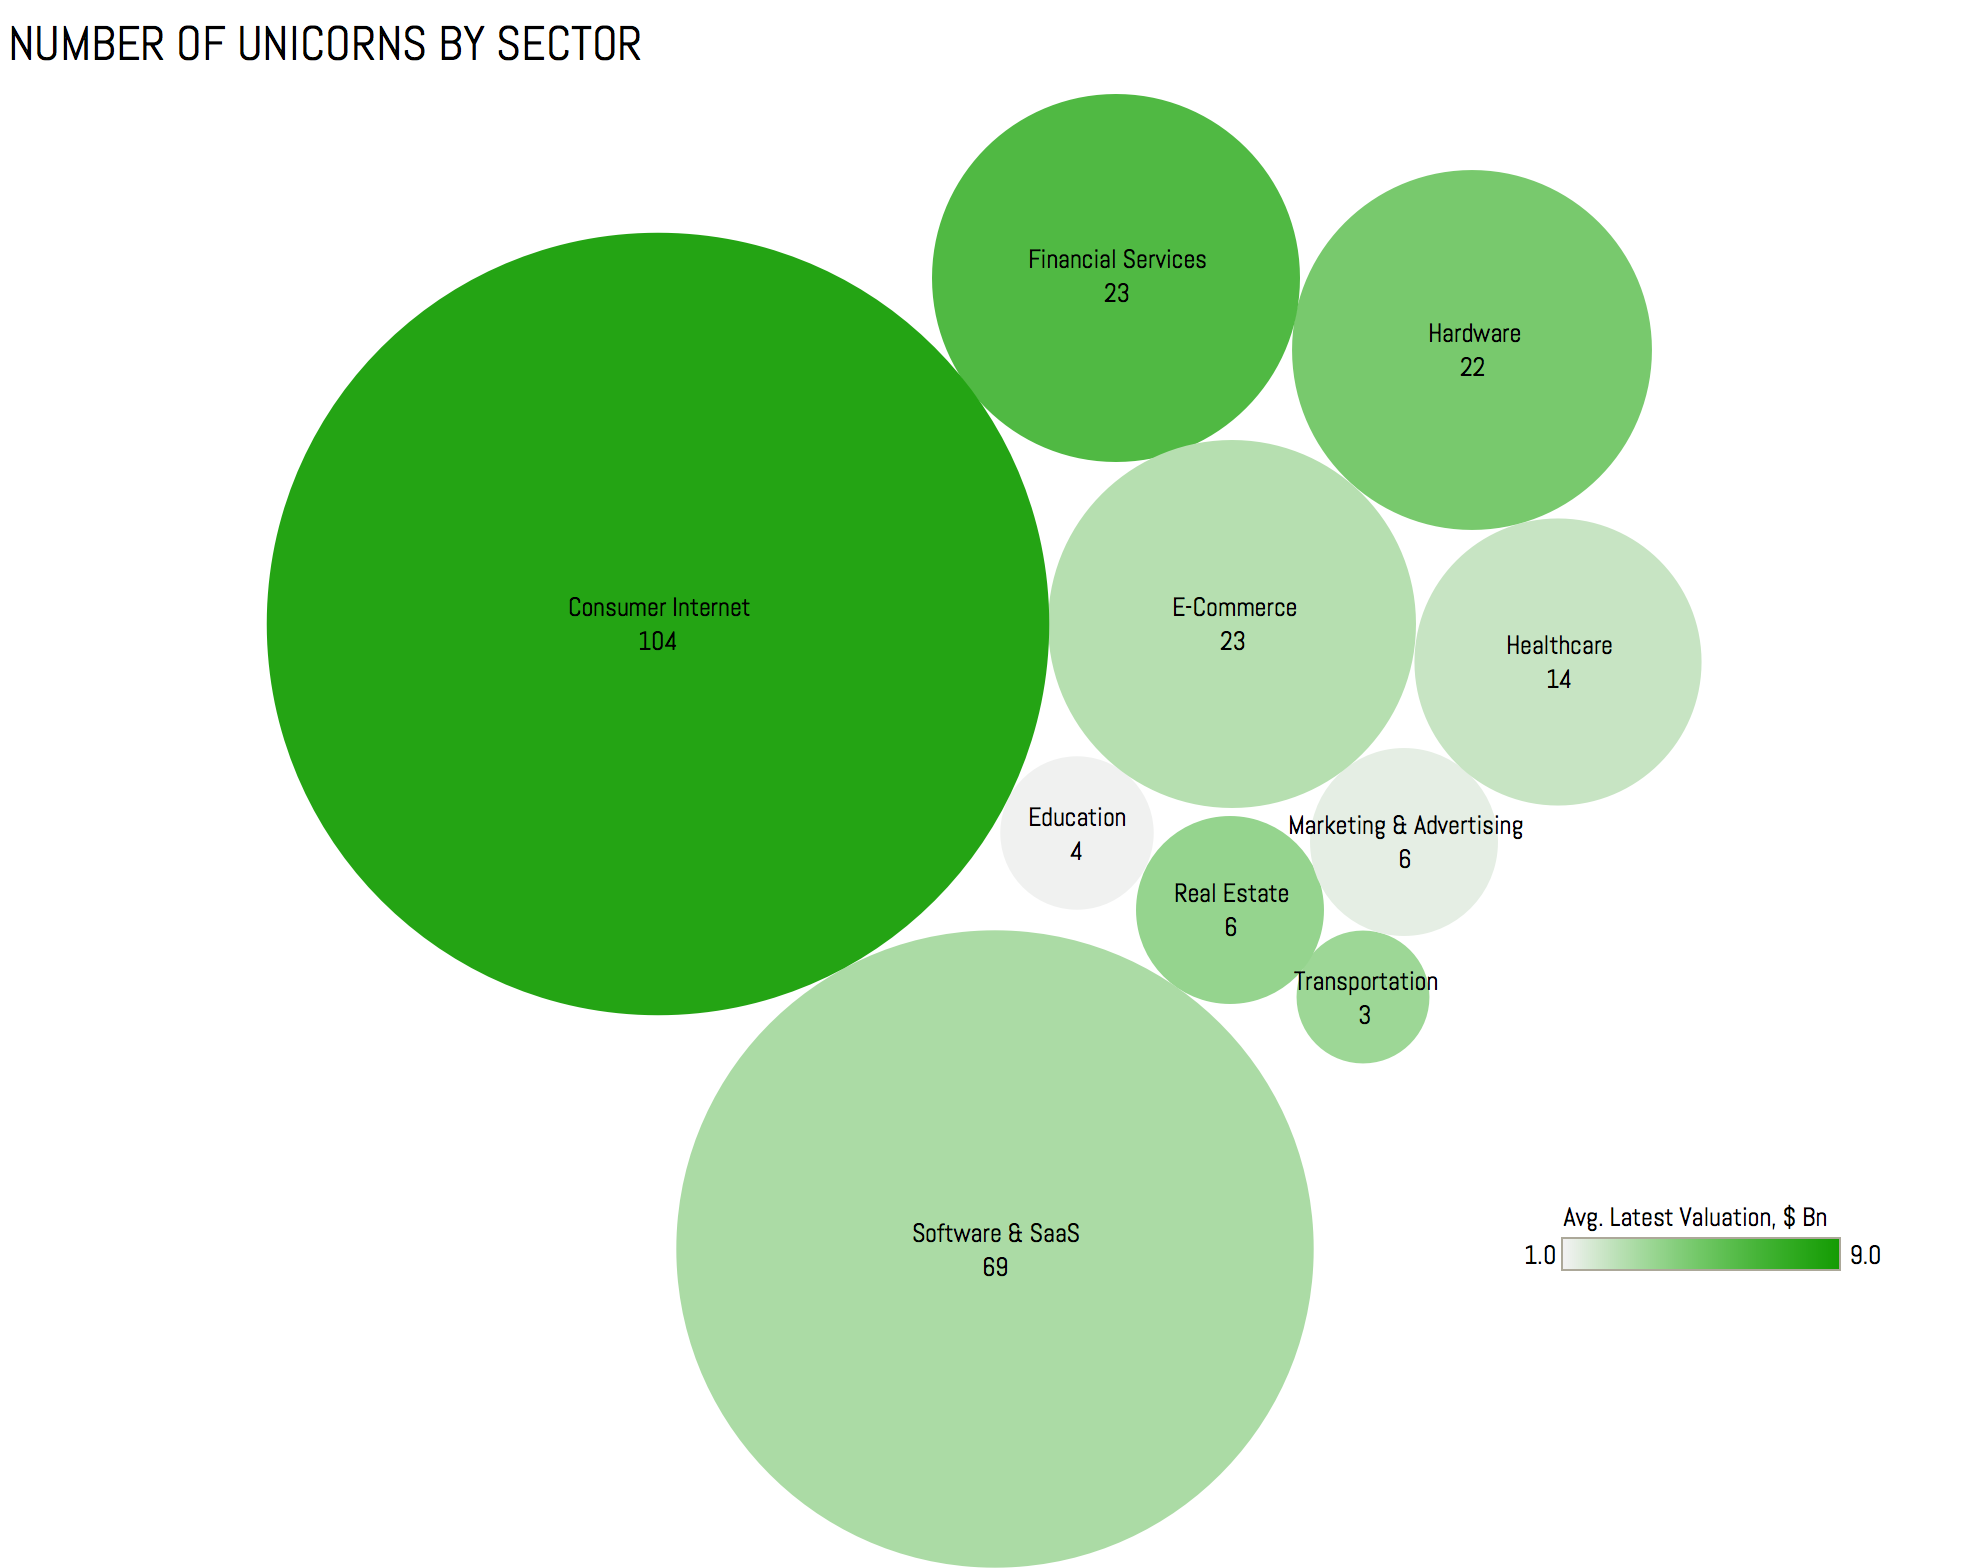
As one might expect, Consumer Internet is both the largest category (104 companies) and also the one with the highest average valuation ($8.2 billion), with the latter once again largely driven by the fact that such companies as Facebook, Uber and Airbnb fall into this category.
Software & SaaS has the second largest number of companies (69), but the valuations are on the lower end ($3.0 billion).
Financial Services and E-Commerce both share #3 spot in terms of the number of startups (23 companies each), although the valuations for Financial Services ($6.2 billion) are significantly higher than for E-Commerce ($2.7 billion).
Finally, Hardware holds the #4 spot with 22 companies and the average valuation of $4.7 billion.
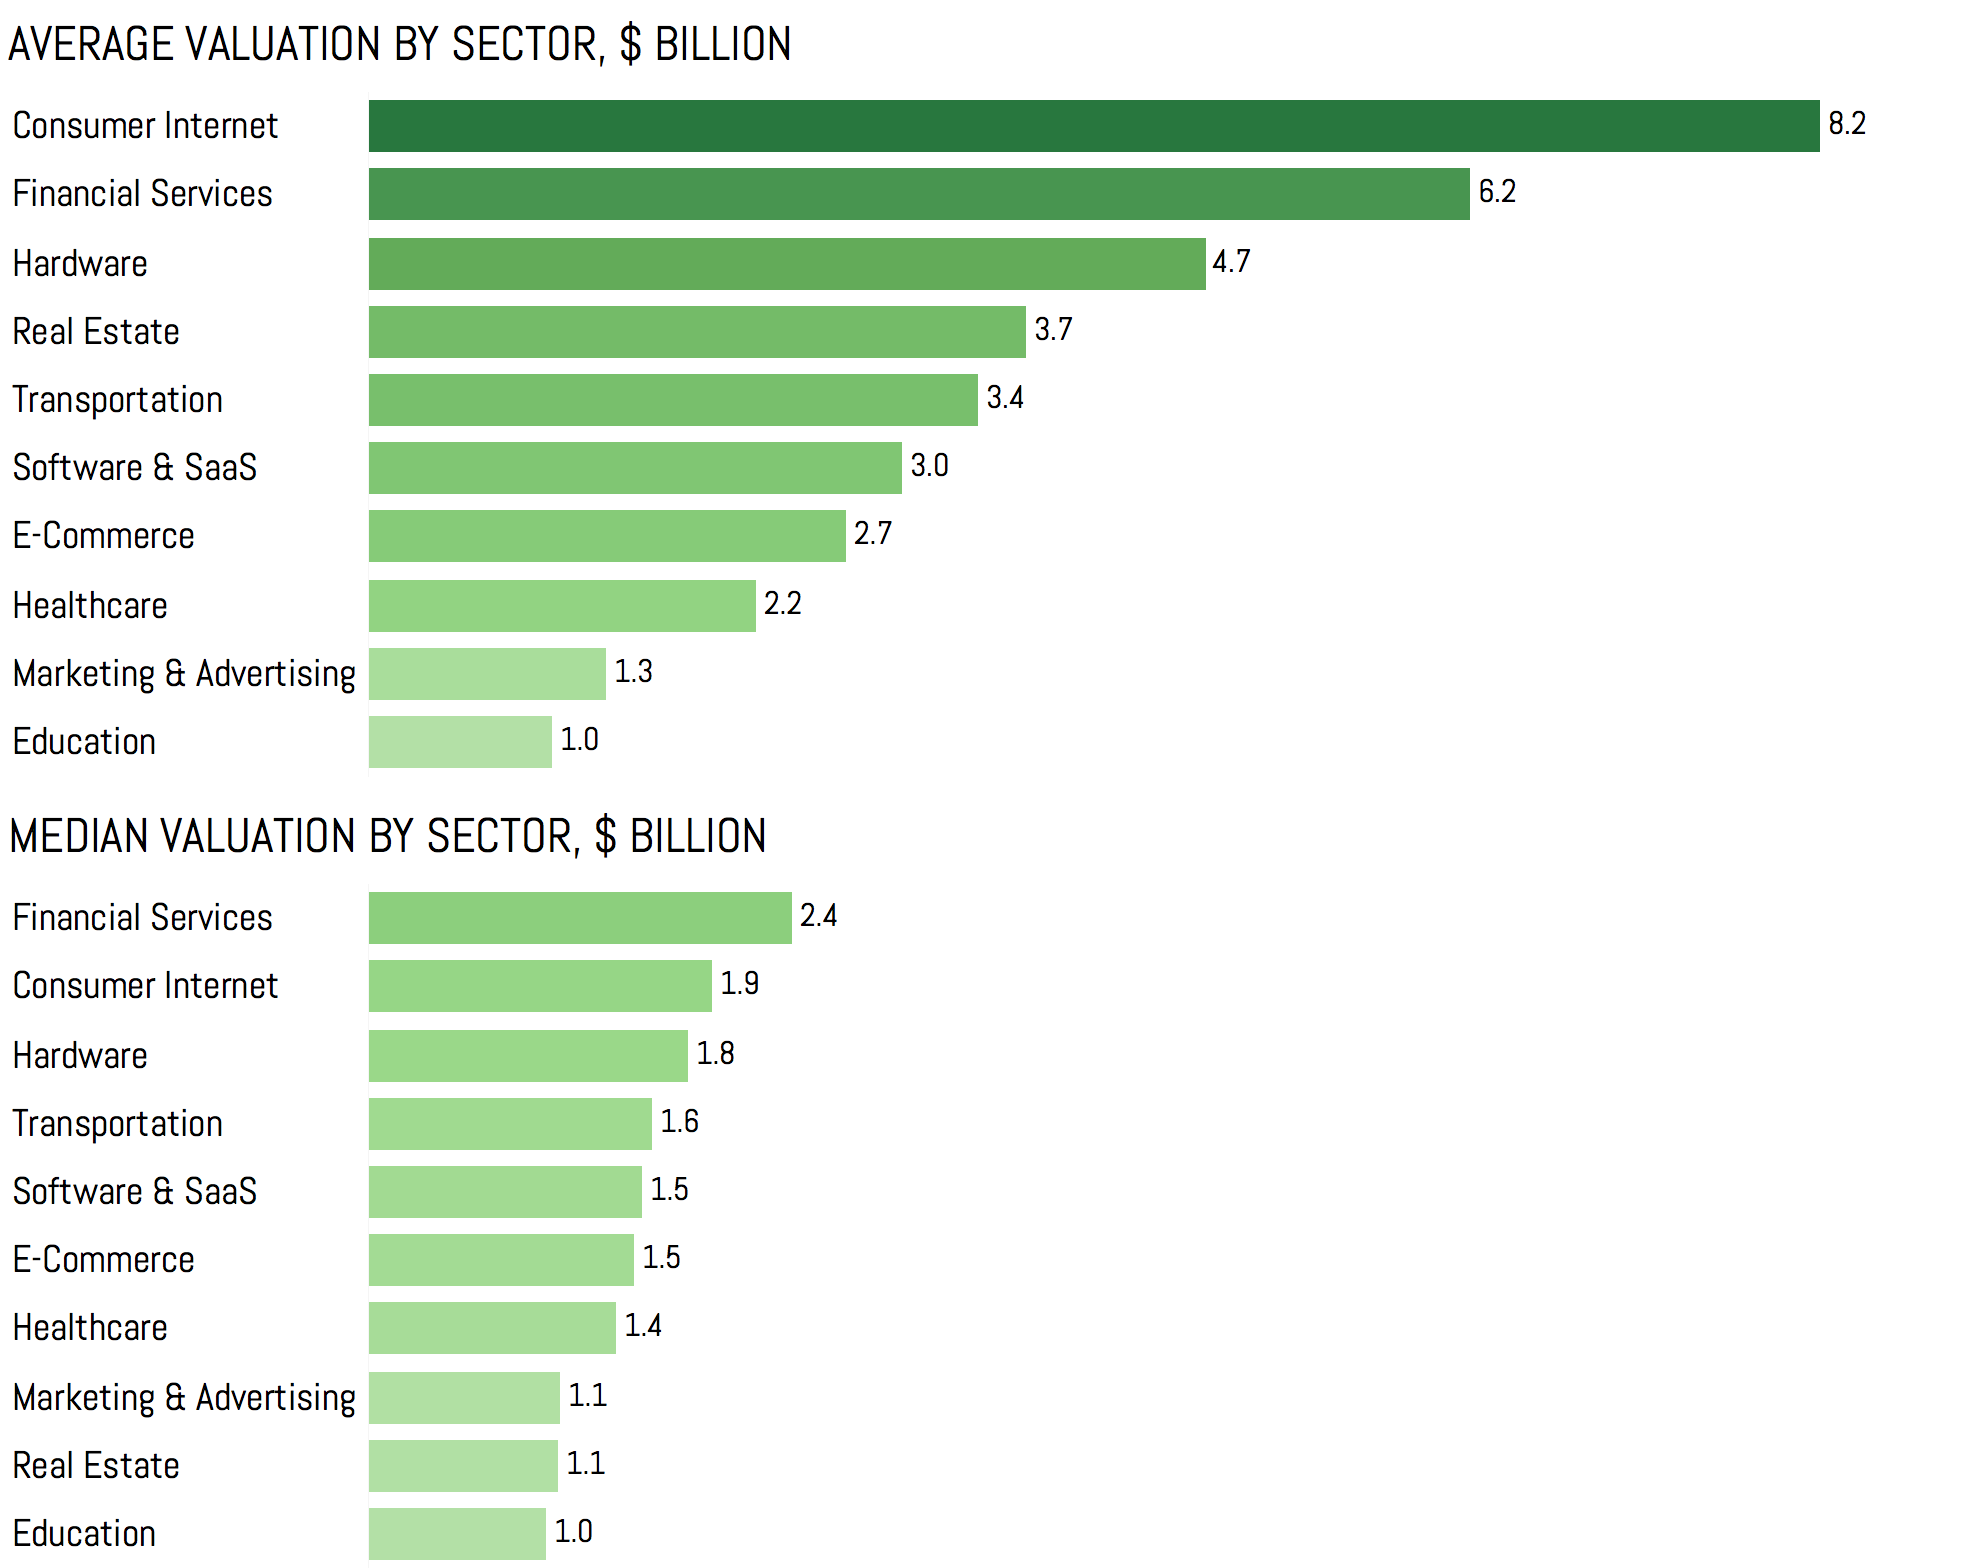
If now we once again switch from the average valuations to the median ones, the overall picture becomes dramatically different. The valuations become much lower compared to the average ones. Moreover, now Financial Services space features the highest median valuation, followed by Consumer Services and Hardware.
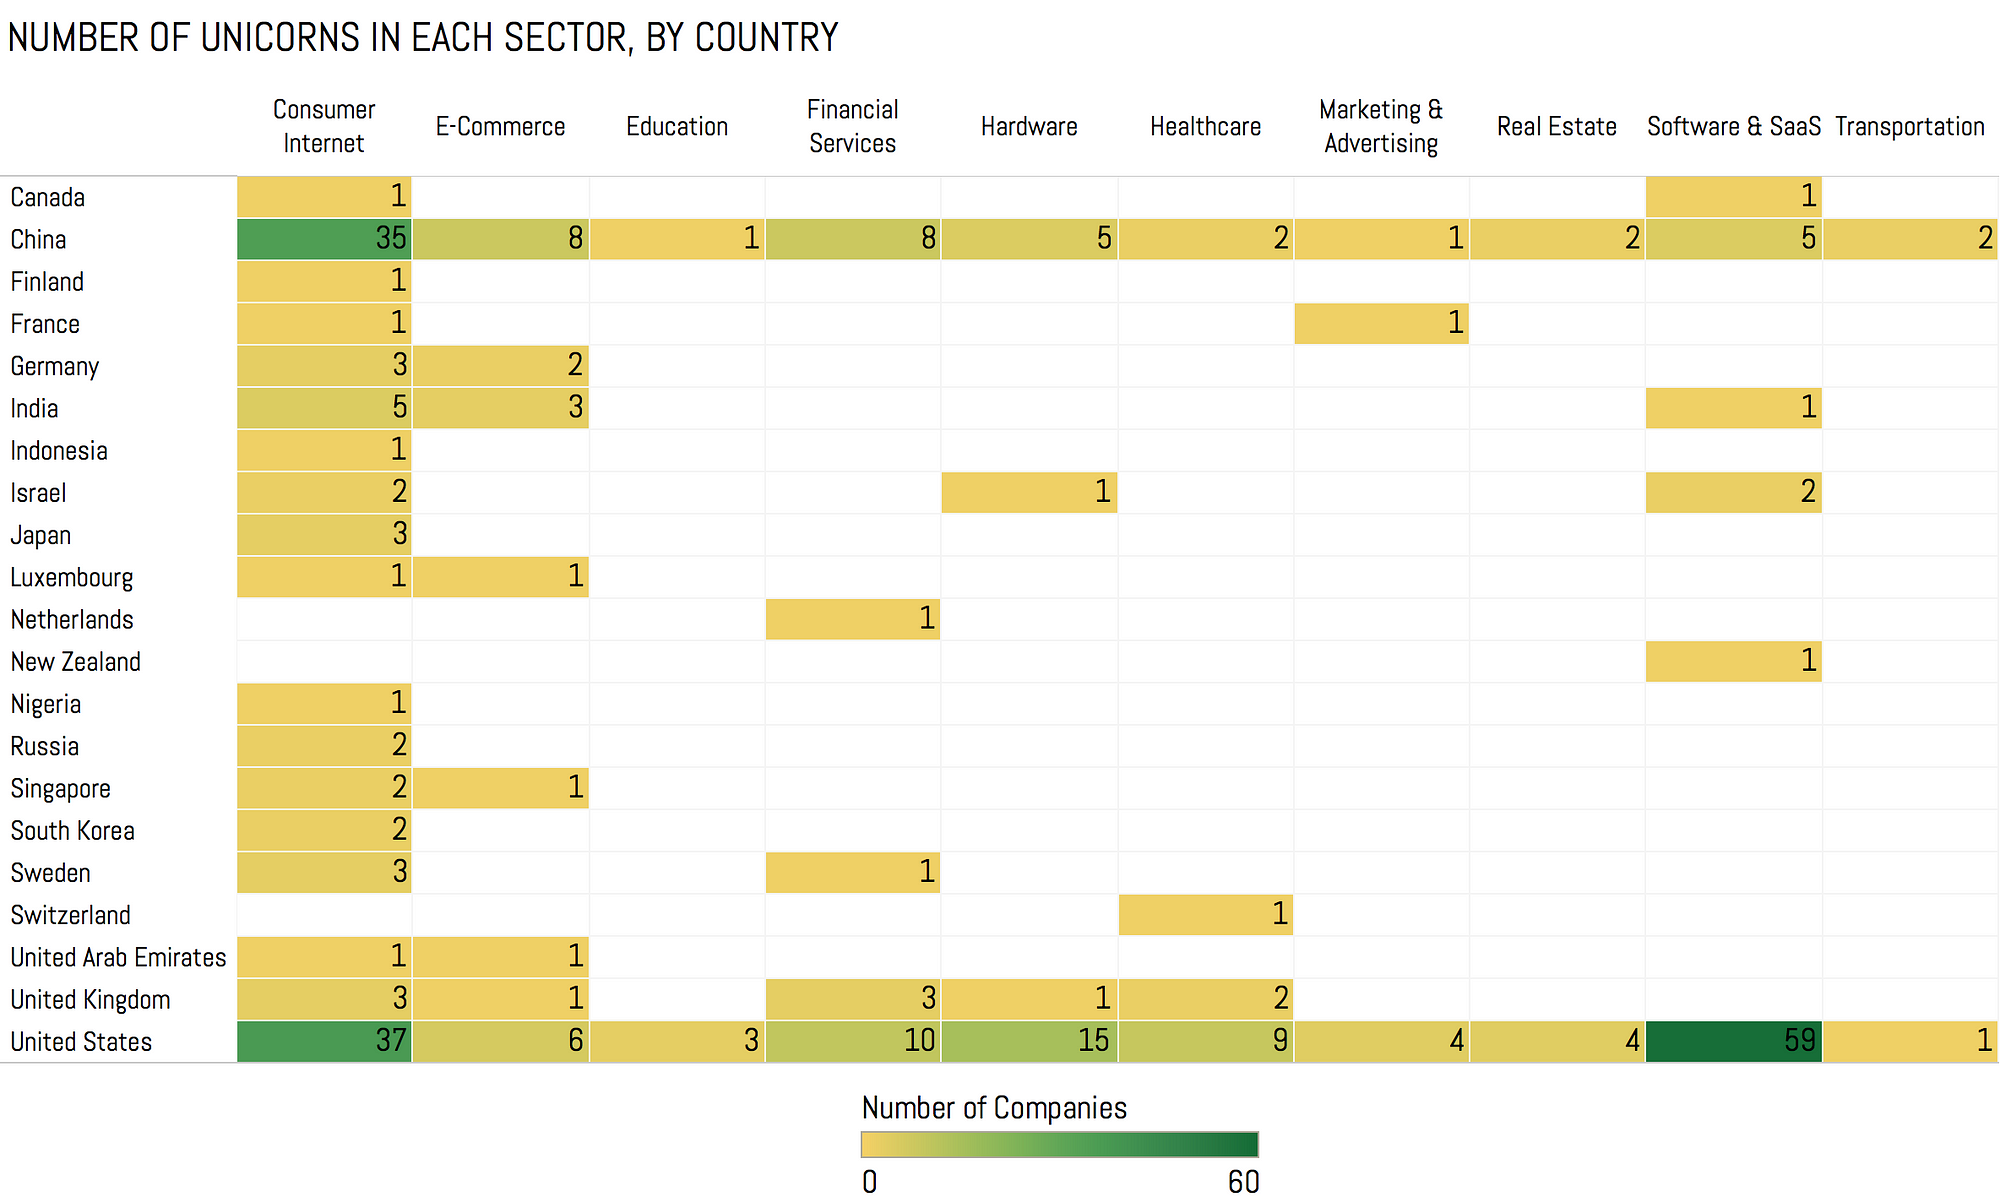
The distribution of startups by sector within each country turns out to be quite interesting. For example, the startup market in China is dominated by Consumer Internet startups (35 companies), while in the U.S. the largest number of unicorns falls under Software & SaaS category (59 companies), with Consumer Internet ending up #2 (37 companies).
Globally, Consumer Internet is almost uniformly the largest space in terms of the number of startups.
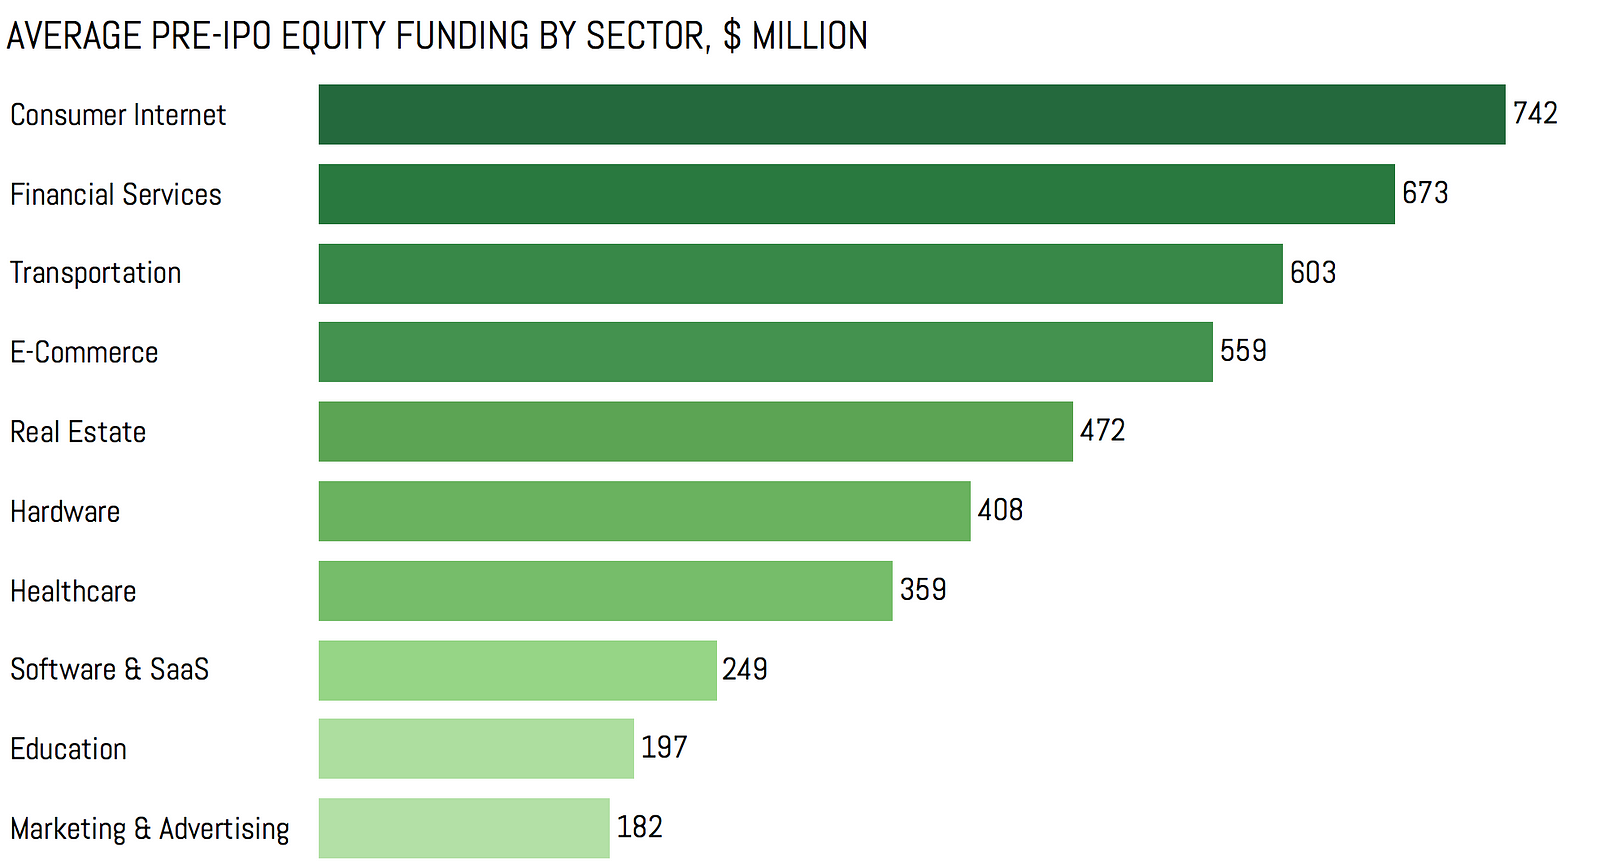
In terms of the average pre-IPO equity funding received, Consumer Internet once again (unsurprisingly) leads the way with $742 million in average funding per company, followed by Financial Services ($673 million), Transportation ($603 million) and E-Commerce ($559 million). Interestingly enough, although one might expect Hardware space to be very capital intensive, it only occupies #6 on the list, with $408 million in average funding.
The Investors
Now that we’ve looked at the unicorns’ themselves, let’s take a peak at who had the most luck investing in the unicorns so far.
Again, an important caveat to make here is that all the data used in this section is drawn from public sources, such as Crunchbase. This means it’s not necessarily exhaustive or up-to-date. In order to perform analysis for this section, I used information about lead investors for the companies in question.
Unfortunately, sometimes the company or the investors chose not to disclose who led the deal, or the information in public sources might actually turn out to be wrong. Therefore, while the rankings you can find below are most likely to be largely accurate, I’d caution anyone from paying too much attention to the exact numbers.
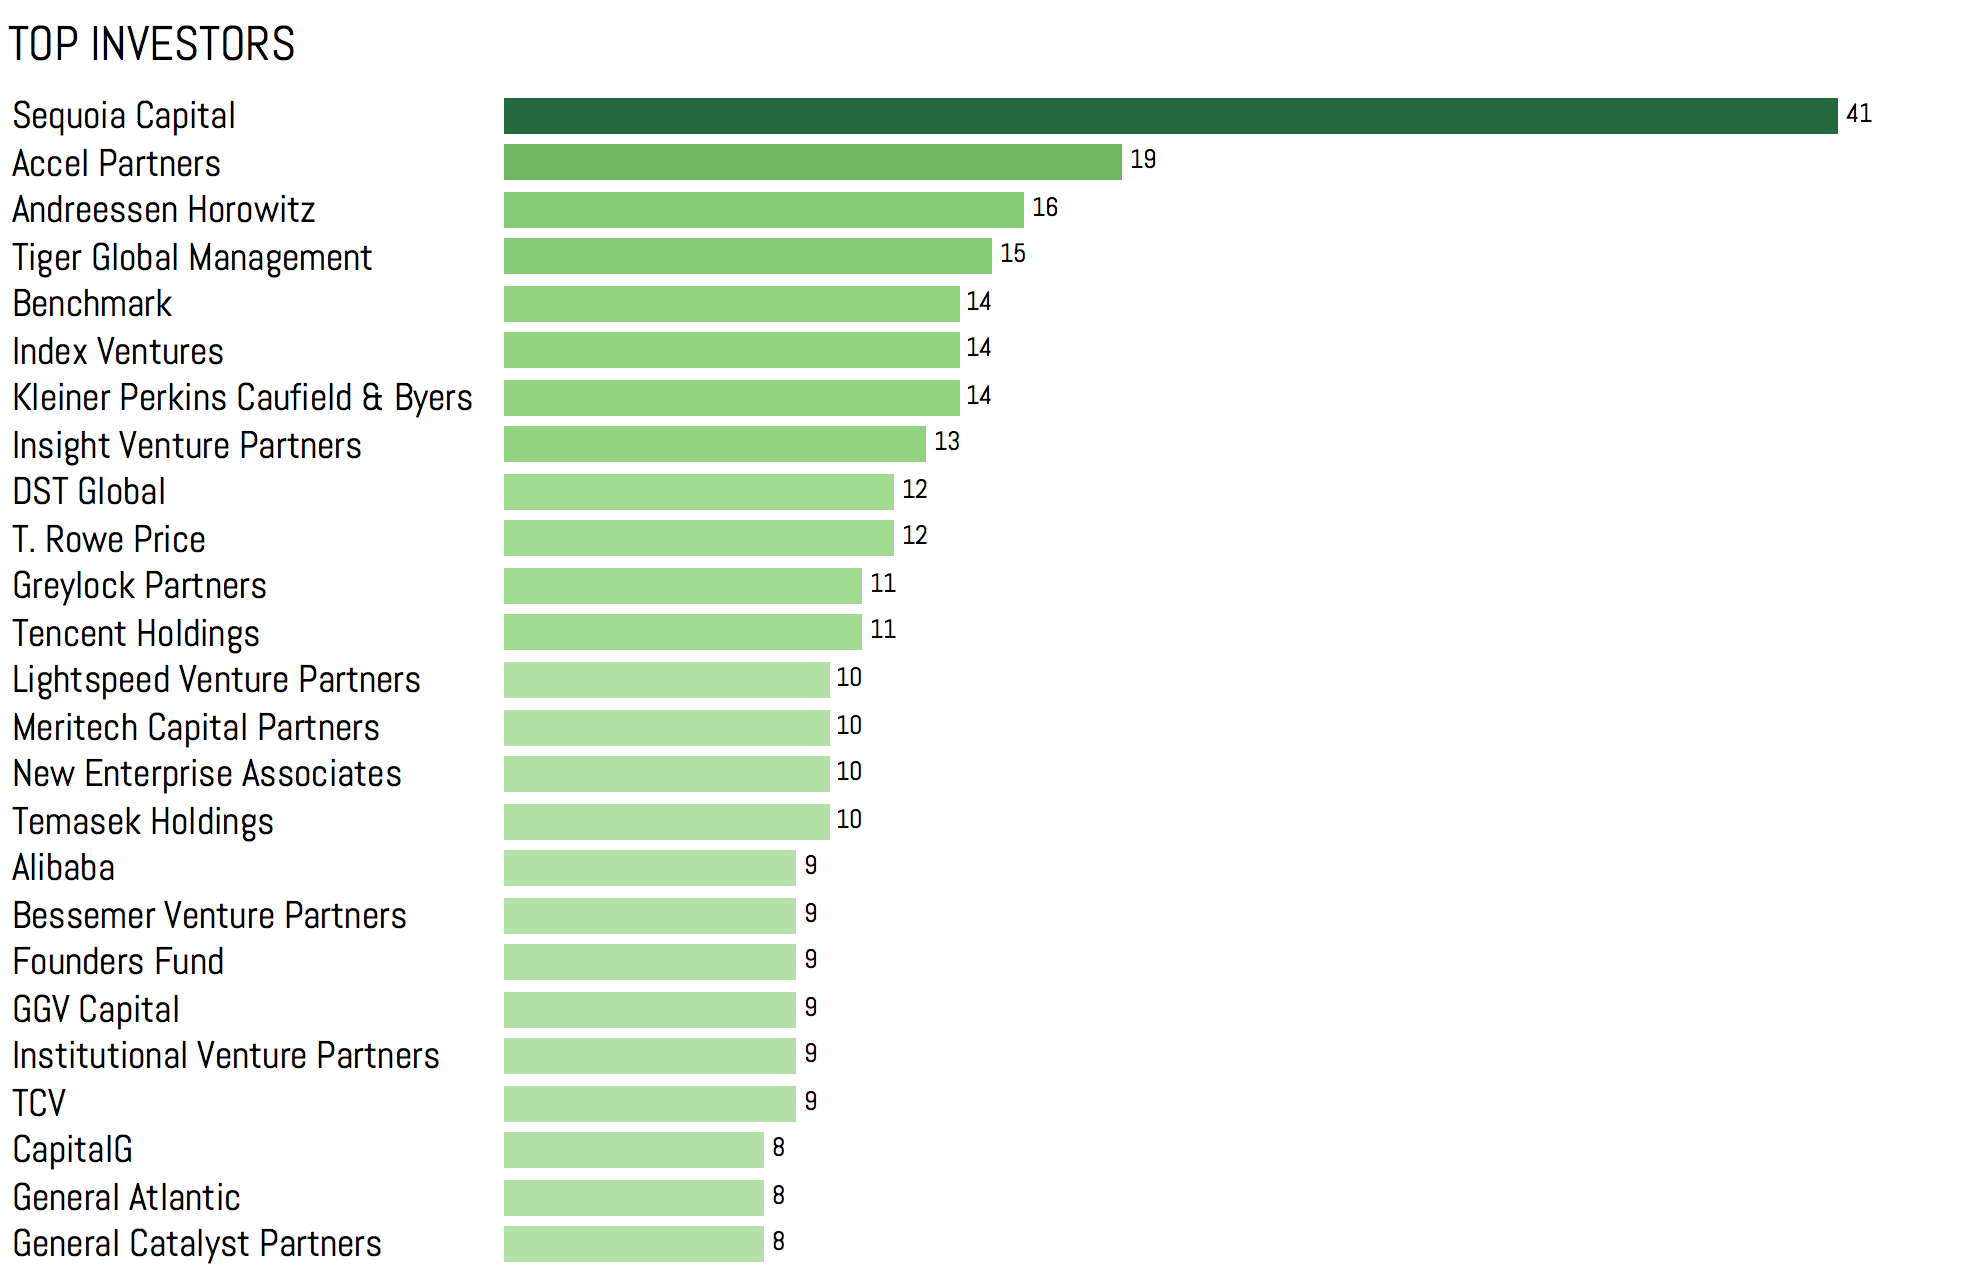
As you can see, Sequoia Capital appears to be an unquestionable leader in terms of the number of investments in unicorns, having provided funding to 41 unicorns so far.
It is then followed by Accel Partners (19 investments), Andreessen Horowitz (16 investments) and Tiger Global Management (15 investments).
Once again, for the purposes of this list, the investor counts only if it acted as a lead investor at least in one of the financing rounds for a particular startup.
Overall, each of the top 25 investors led investments in at least 8 unicorns.
Now, while those numbers are interesting, over the last years, quite a few funds have done some very late stage investments in the unicorns. For some of them, doing growth stage/late stage investments has always been part of the strategy, but many have chosen to do those deals in order to be able to add already famous companies to their portfolios.
While this strategy isn’t necessarily bad, it’s hard to expect it to provide the returns that are as high as someone who invested in a successful company at the earliest stages might expect to enjoy (again, it can actually be the case that the late stage investors enjoy better returns than the early stage ones, but for the sake of argument let’s assume that this is generally not the case with most of those companies).
Therefore, it might be interesting to look at how the list of the most active early stage investors differs from the one shown above, with funds doing investments across all stages. To do that, let’s define early stage as Angel/Seed, or Series A/B/C investments.
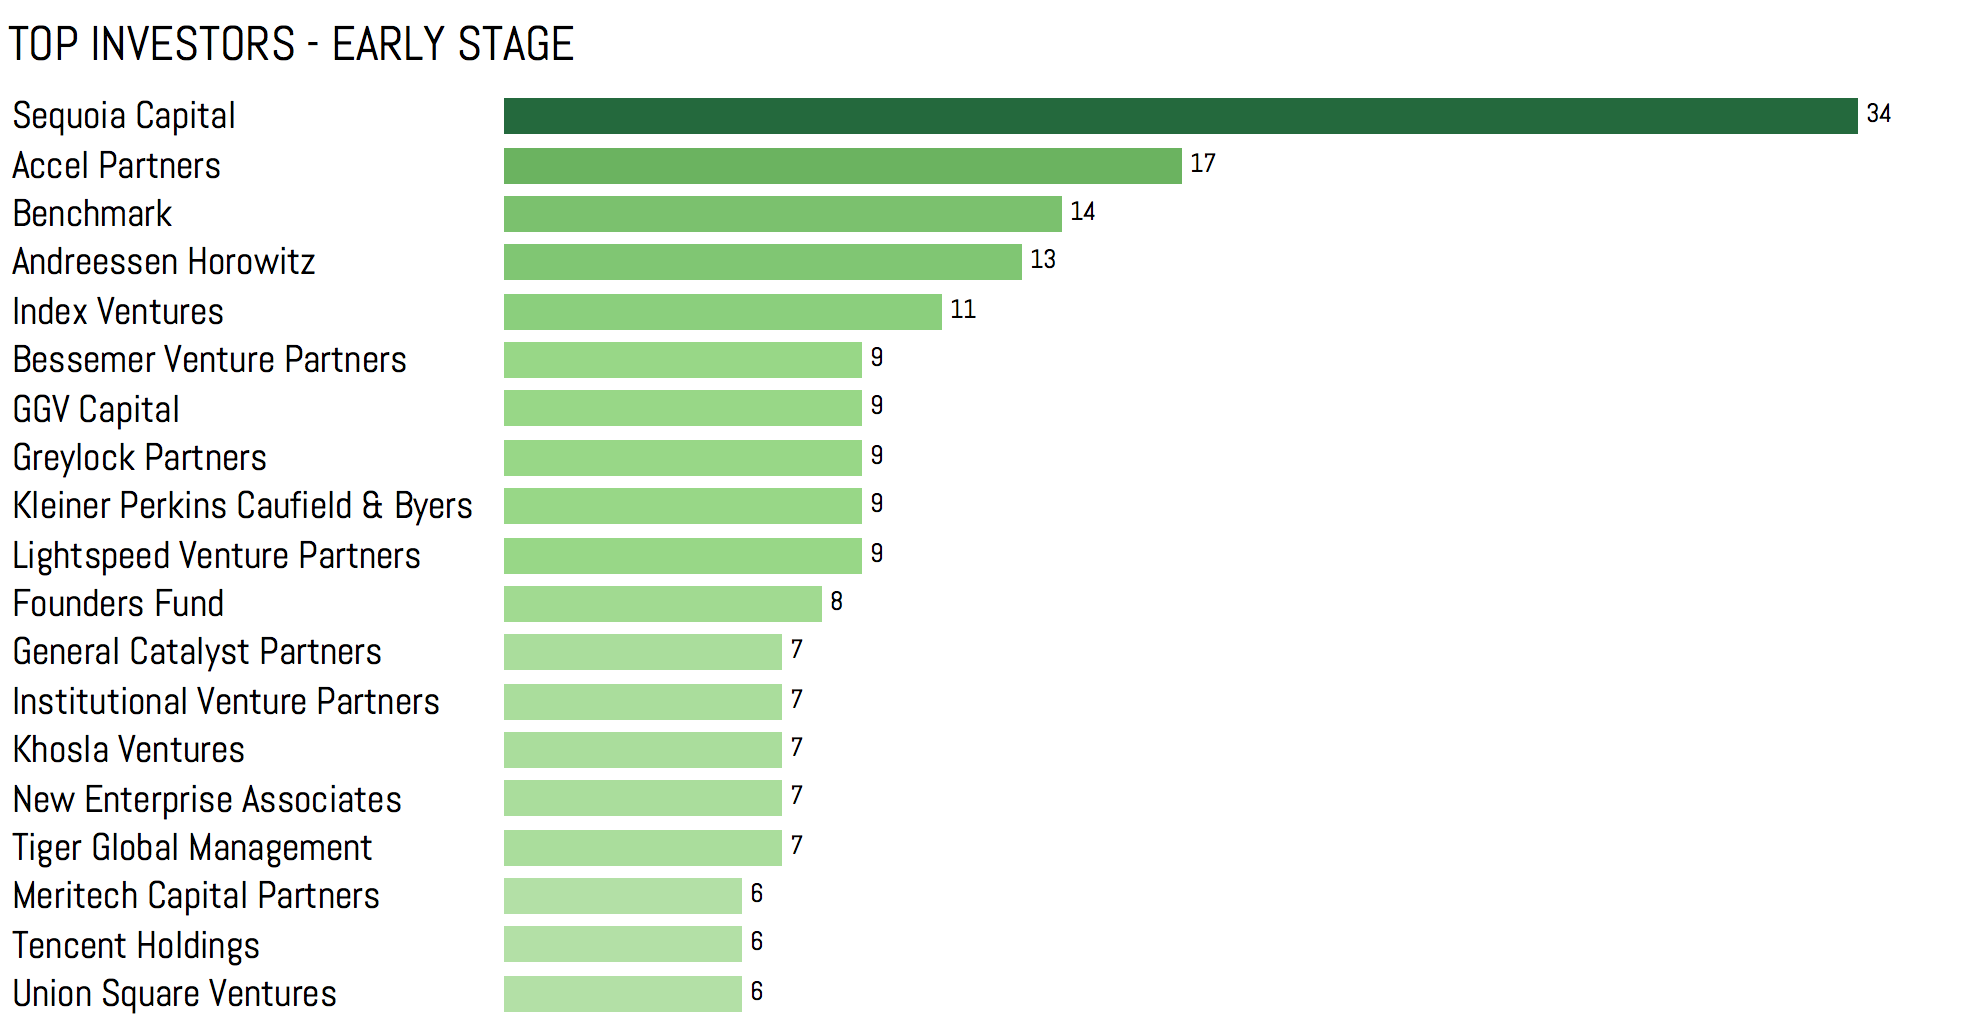
Here, Sequoia Capital again emerges as undisputed leader with investments in 34 unicorns. It is then followed by Accel Partners (17 companies), Benchmark (14 companies) and Andreessen Horowitz (14 companies).
Notice that some of the investors present in the overall list can now either be found much lower down the list for early stage investors (e.g. Tiger Global Management) or are missing alltogether (e.g. DST Global or Alibaba). This obviously means that early-stage investments are generally not part of their strategy.
At the same time, for example, Accel Partners was an early stage investor in 17 out of 19 unicorns it invested in overall, and Benchmark was an early stage investor in all 14 unicorns it ended up investing in (which isn’t particularly surprising given that it’s an early-stage focused fund in the first place).
Exit Opportunities
Now let’s look at the exit opportunities for the unicorns. For the obvious reasons, those are perhaps the most important thing for the investors, as it is ultimately the exit price, and not the private valuations in subsequent financing rounds, that determines the returns for the investors (unless, of course, you somehow manage to negotiate selling your stake in a secondary transaction in one of the later rounds).
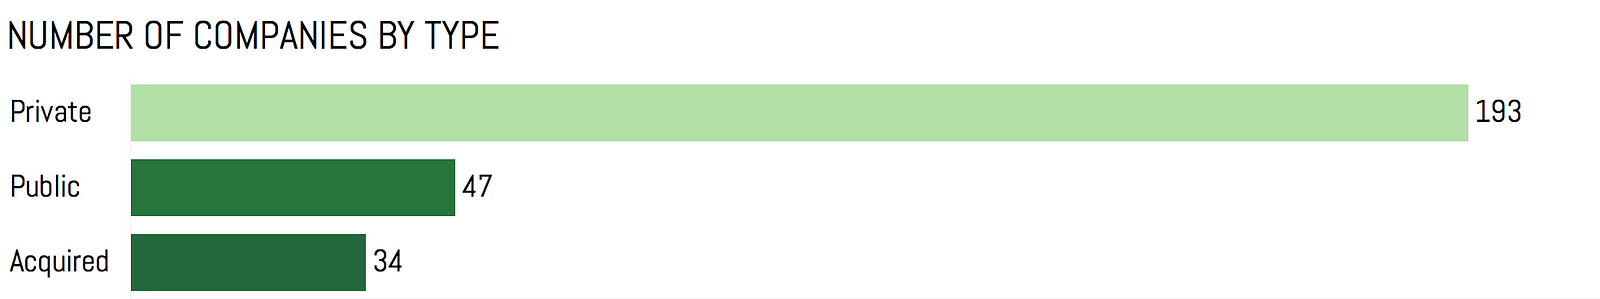
The majority of the unicorns (193, or 70.4%) remain private. Of the rest, 47 (or 17.2%) of all unicorns are publicly traded, while 34 companies (or 12.4%) have been acquired.
Let’s first take a look at the acquisitions’ numbers:
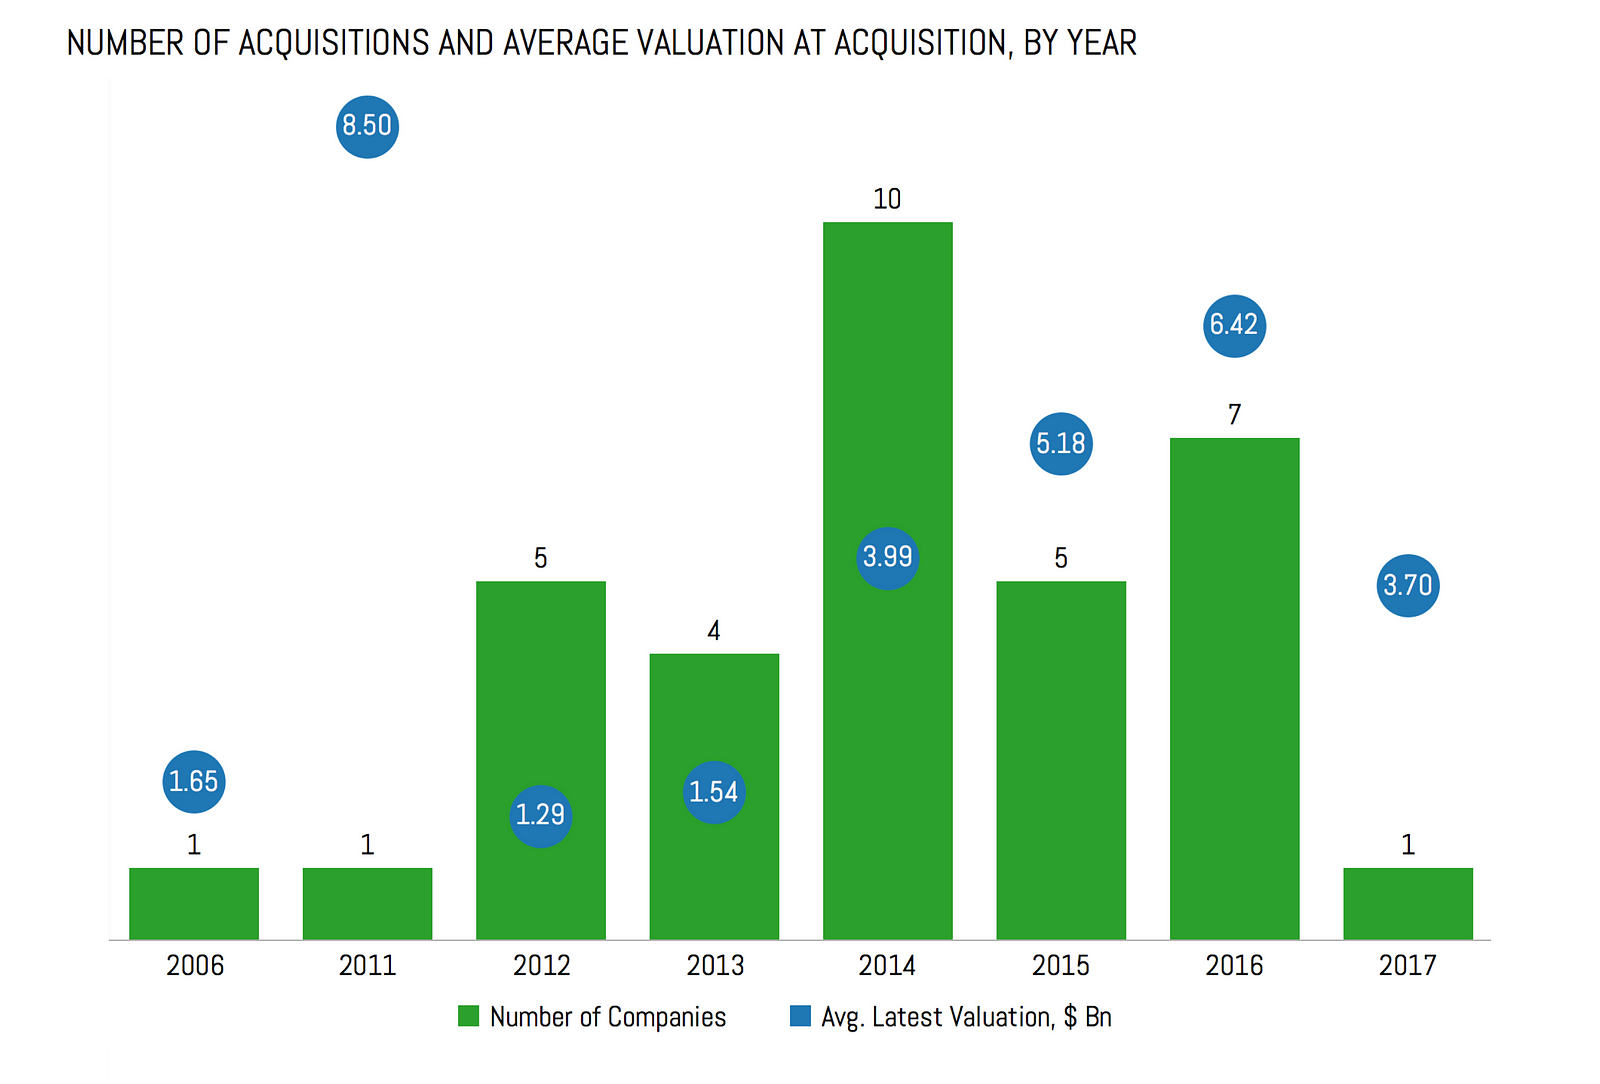
The one outlier on this chart you immediately notice is YouTube, acquired by Google for $1.65 billion in 2006, after only about 1.5 years since being founded.
Another easily noticeable outlier is Skype. This one is tricky, being first acquired by eBay in 2005 for $2.6 billion, only to be sold to a consortium of private equity investors in 2009, and finally acquired by Microsoft in 2011 for $8.5 billion. For the sake of this analysis, I used the last acquisition price (I also put Skype under subsidiary/JV category, so it’s excluded from the 3rd chart at the beginning of this post).
Overall, there is a lot of volatility both in terms of the number of companies acquired, and the average valuations over the years, with 2014 and 2016 being particularly active years in terms of number of acquisitions, with 10 and 7 acquisitions respectively.
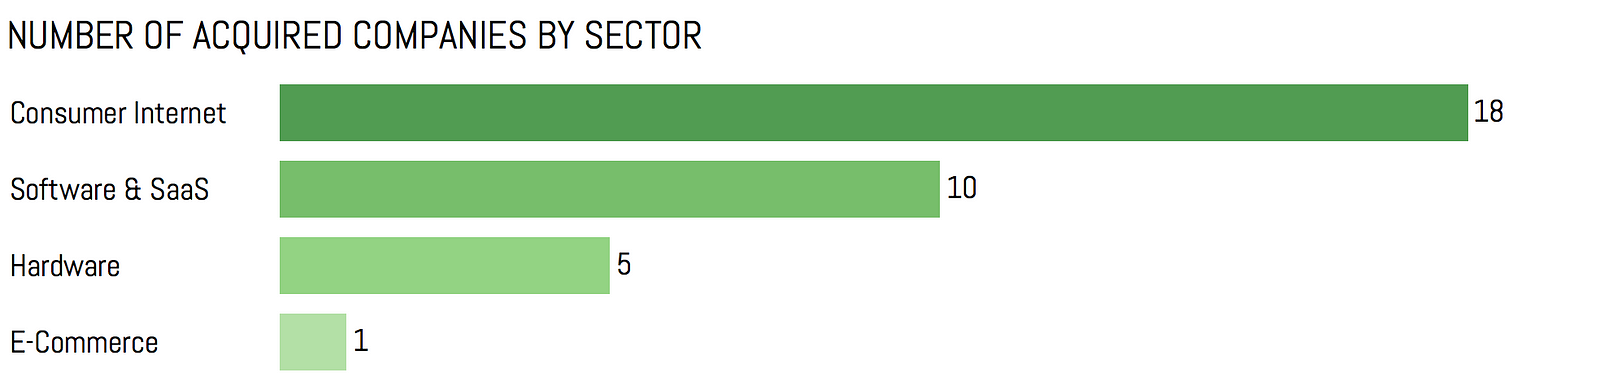
The majority of the acquired companies work in Consumer Internet space, followed by Software & SaaS, Hardware and E-Commerce. Not a single company from any of the other sectors has been acquired so far.
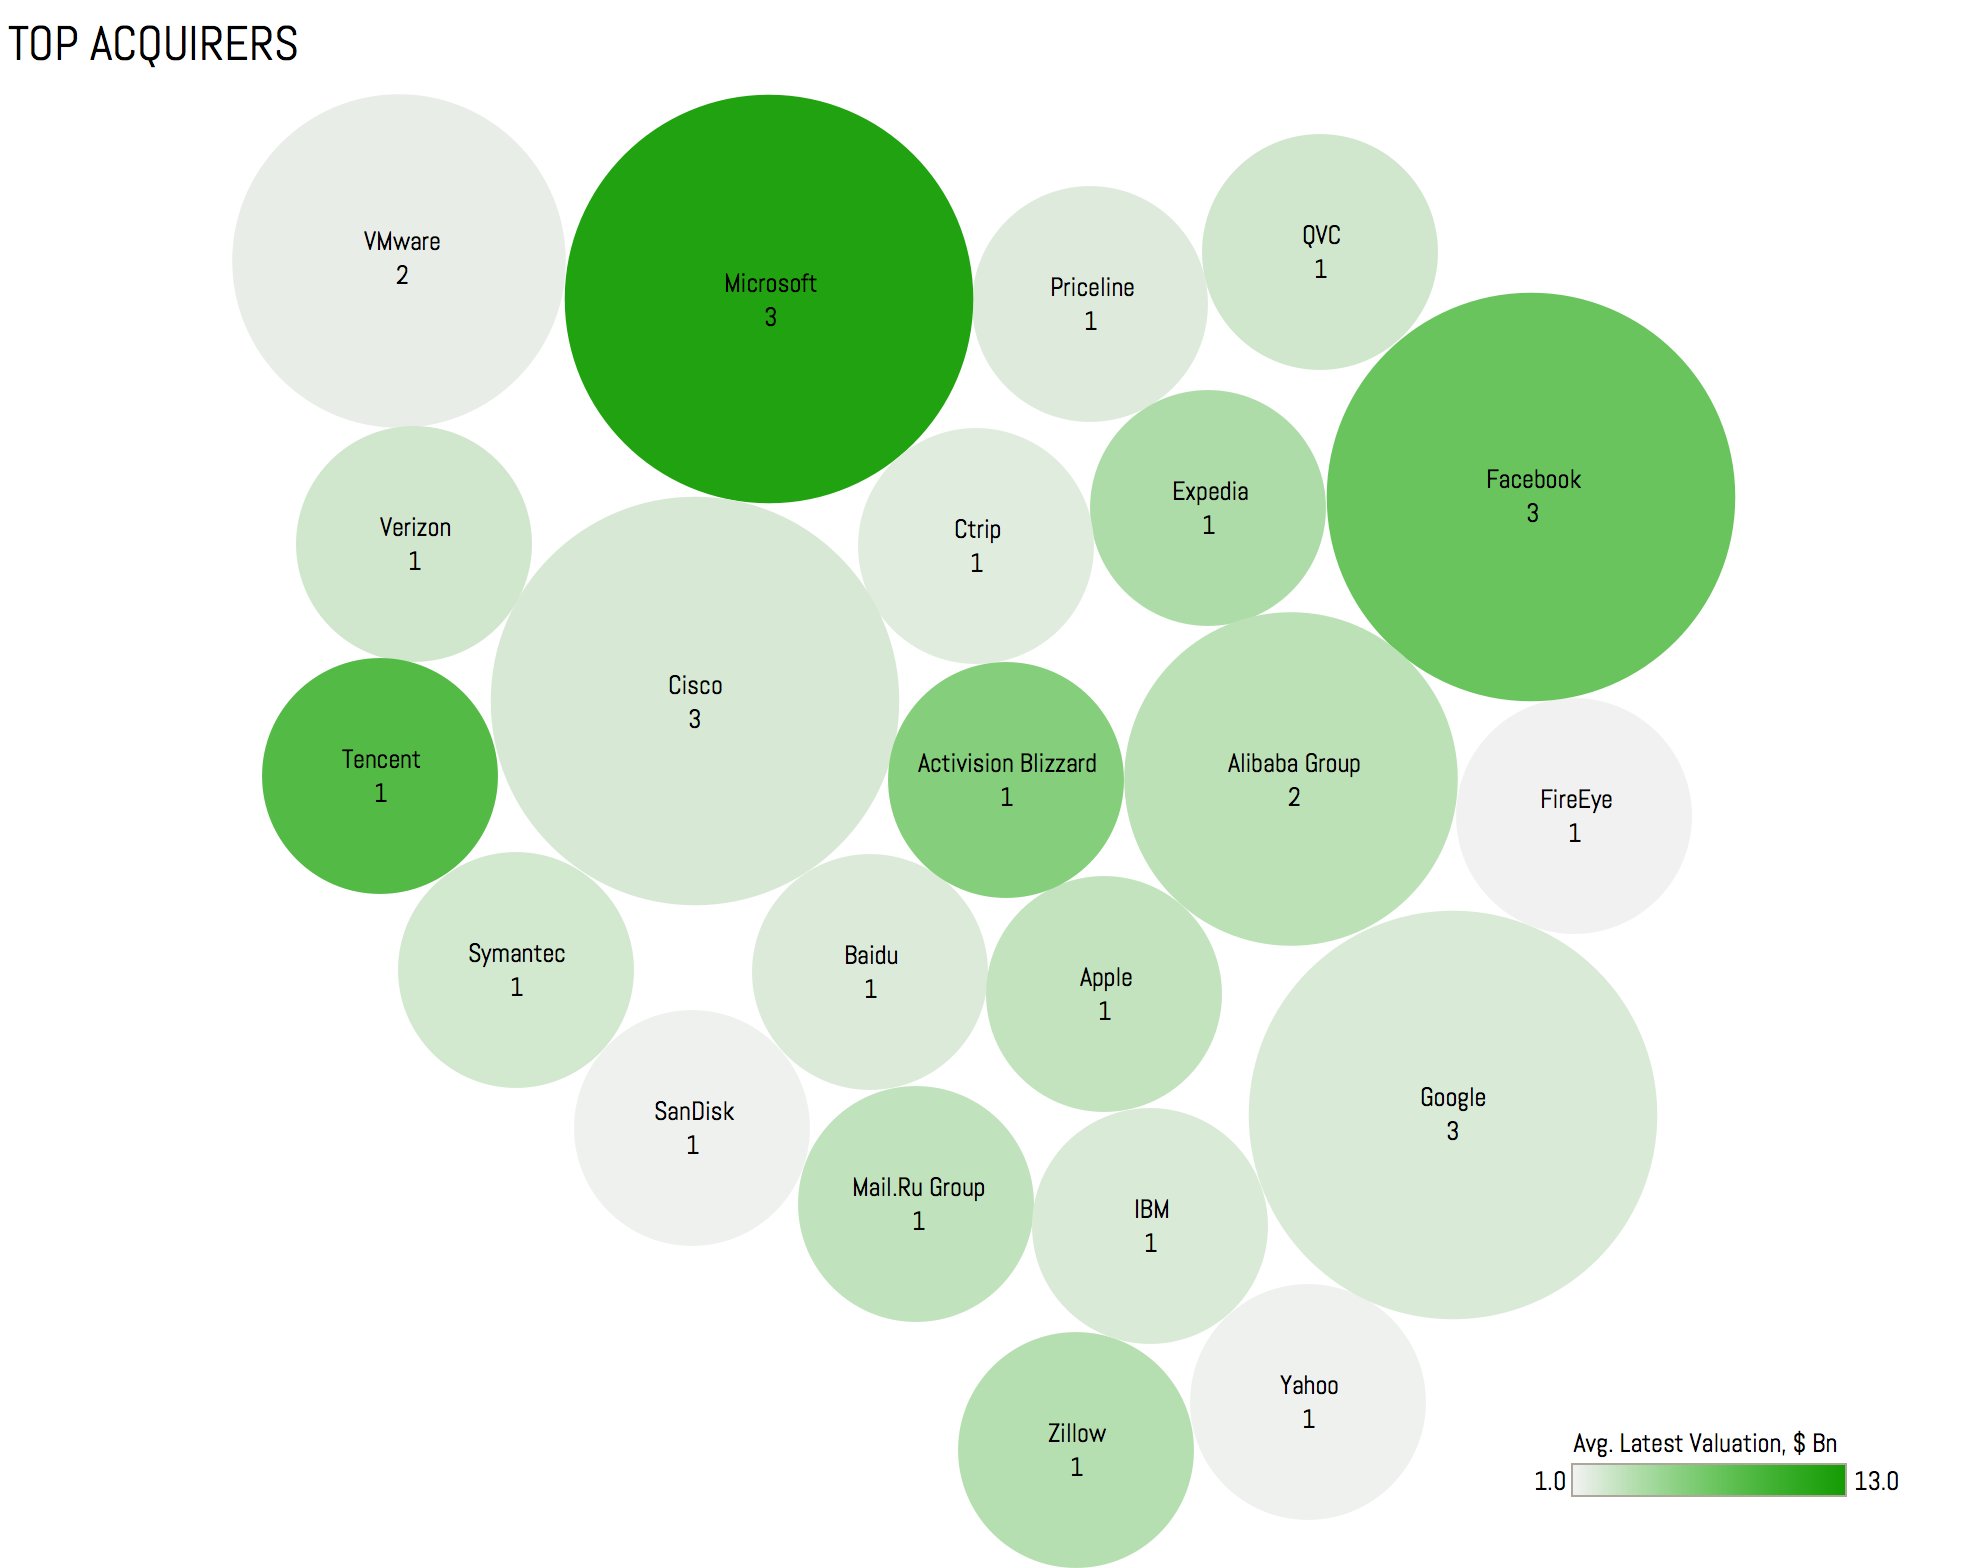
Microsoft, Facebook, Cisco and Google turned out to be the largest acquirers, having bought 3 companies each. Microsoft has also paid the highest average price per company ($12 billion), largely driven by LinkedIn and Skype acquisitions. For Facebook, the average price paid was $7.3 billion, again largely influenced by Whatsapp acquisition.
Tencent and Activision Blizzard each only bought 1 company, but paid quite a lot for those, with Tencent purchasing Supercell for $8.6 billion and Blizzard buying King.com for $5.9 billion.
Now let’s move to the publicly traded companies:
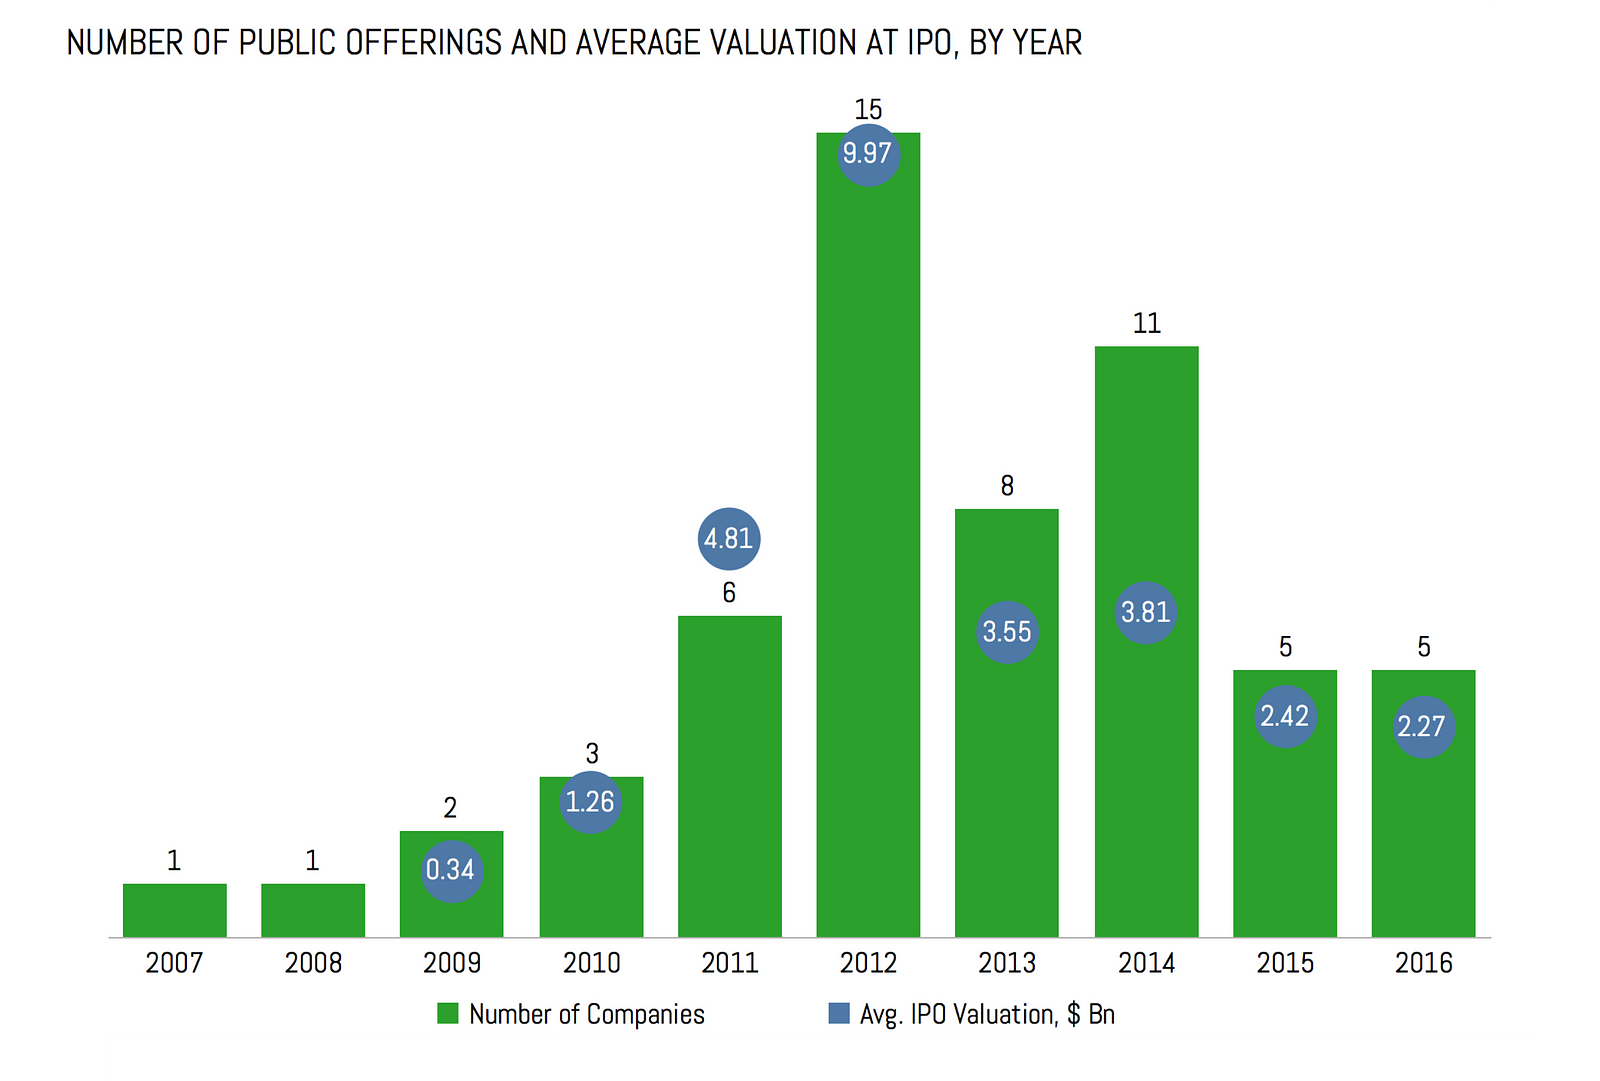
Again, there is significant volatility both in the number of companies and the average valuations from year to year. 2012 was the most successful year both in terms of the number of new public offerings (15 public offerings, including those of Facebook, Workday, ServiceNow and Palo Alto Networks) and the average valuation at IPO ($9.97 billion, largely driven by Facebook’s public offering).
A couple companies also had early IPOs, with New Zealand based Xeroholding a public offering in 2007, just about a year after it was founded, and Japan based GREE going public in 2008. Unfortunately, it turned out to be very hard to uncover IPO valuations for either of those.
Also, this chart showcases the well-publicized cooling of the IPO environment in 2015 and 2016, with more and more companies choosing to stay private longer, and opting to raise funding on the private markets (the abundance of venture capital, especially in 2015, also helped).
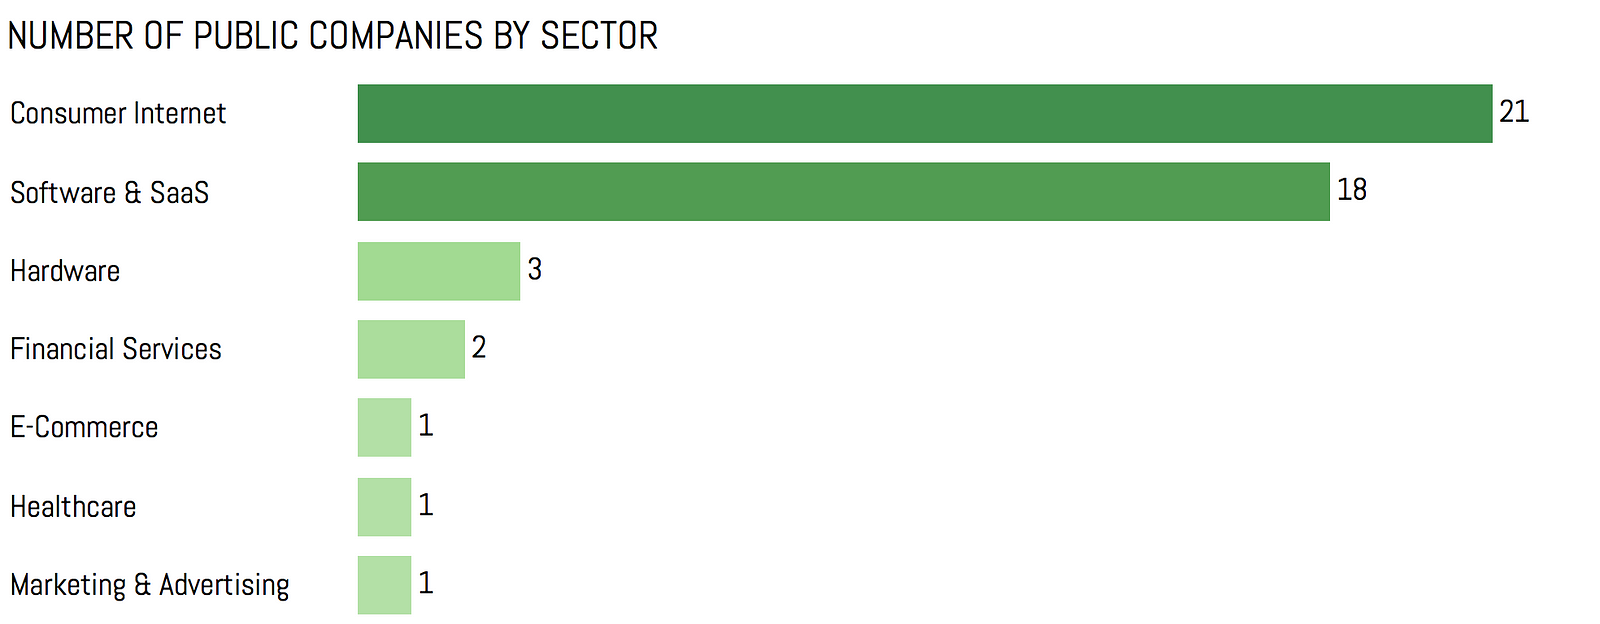
From the sector perspective, Consumer Internet and Software & SaaS are once again leading the pack, with 21 and 18 IPOs respectively. However, there is also a bit variety here, compared to the acquisitions chart, with a few companies in Financial Services, Healthcare and Marketing & Advertising spaces also going public, in addition to Hardware and E-Commerce sectors we’ve seen on the acquisitions chart.
Conclusion
This is by no means a comprehensive analysis of the “Unicorn Club”, but I hope it provides at least some interesting insights into this very peculiar market.
In just 3 years, the number of unicorns has more than tripled (274 today vs. 83 in my initial dataset from 2014). Is it a good thing that so many companies are now boasting the valuations that were almost unimaginable just a few years ago? Maybe not, and I’m pretty sure that some of the companies featured in this analysis might witness their valuations taking a significant hit in the near future.
Still, unless the market conditions change significantly and venture capital suddenly becomes less abundant (which is unlikely to happen, with initiatives like Softbank’s $100 billion fund underway), we will probably see even more companies reaching the “unicorn” status in the near future. Therefore, it might be interesting to revisit this topic and run similar analysis in another 3 years, and see how the market will change. Hopefully, someone will do it; one can hope.
In case anyone is interested to play with the full dataset used for this analysis, I’m happy to share it: just e-mail me
Added: I was reminded that it might not be a good idea anymore to call the startups worth over $1 billion “unicorns”, considering that there are close to 300 of such companies now. I wholeheartedly agree that this term doesn’t make much sense at this point. The only reasons why I decided to stick with it in this article is because it’s widely recognizable today and in a certain way it helps to establish the connection with the previous examinations of the world’s most expensive startups.
Also, please see a couple of of corrections highlighted by the readers below.
It turns out that there is at least one company in South America that qualifies under the definition of “unicorn”: Argentina-based Globant was founded in 2003 and is publicly traded now, with the market capitalization of $1.23 billion.
Powa Technologies’ valuation of 2014 turned out to vastly exaggerated by the company. In 2016, the some of the core businesses of Powa were sold off, and the company ceased its operations. Another company that might no longer belong to the list is NJOY, which filed for bankruptcy in September 2016.
If there are any other things worth highlighting, please don’t hesitate to reach to me, and I’d be happy to correct those!
Shared by Startup Grind on Medium.
